


Abstract
Background: Although mammographic breast density is associated with the risk of breast cancer and is influenced by hormone levels, the effects of tamoxifen on breast density in healthy women and whether tamoxifen-induced density changes are associated with breast cancer risk are unclear. We investigated mammographic breast density in healthy women with an increased risk of breast cancer at baseline and during 54 months of tamoxifen treatment. Methods: Mammograms were reviewed from 818 breast cancer–free women (388 in the tamoxifen group and 430 in the placebo group) at high risk for breast cancer, from the International Breast Cancer Intervention Study I, a trial of tamoxifen for breast cancer prevention. Breast density measurements, at baseline and during treatment, were obtained at 12- to 18-month intervals. Multivariable analysis was used to assess associations with breast density. All statistical tests were two-sided. Results: Breast density at baseline was similar in placebo (42.6%, 95% confidence interval [CI] = 39.6% to 45.6%) and tamoxifen (41.9%, 95% CI = 38.8% to 45.0%) groups. The main determinants of breast density at baseline were age, menopausal status, body mass index, and previous atypical hyperplasia. A greater density reduction in the tamoxifen group (7.9%, 95% CI = 6.9% to 8.9%) than in the placebo group (3.5%, 95% CI = 2.7% to 4.3%) was apparent within 18 months of treatment (P<.001); the reduction in density continued until 54 months of treatment. After 54 months of tamoxifen treatment, breast density was 28.2% (decrease from baseline = 13.7%, 95% CI = 12.3% to 15.1%; P<.001) in the tamoxifen group and 35.3% (decrease from baseline = 7.3%, 95% CI = 6.1% to 8.4%; P<.001) in the placebo group. The tamoxifen-associated density reduction was apparent in all subgroups, but there was a statistically significant interaction with age. In women aged 45 years or younger at entry, the net reduction with tamoxifen was 13.4% (95% CI = 8.6% to 18.1%), whereas in women older than 55 years, it was 1.1% (95% CI = −3.0% to 5.1%). Conclusion: Tamoxifen treatment was associated with reduction in breast density, most of which occurred during the first 18 months of treatment.
It is now clear that tamoxifen can reduce the risk of breast cancer by 30%–40% among women at high risk for breast cancer; however, tamoxifen has clinically significant side effects, and the overall risk–benefit ratio is still uncertain (1,2). It is also clear that tamoxifen prevents only estrogen receptor (ER)–positive breast cancer and has no effect on or slightly increases the incidence of ER-negative cancers (2). Thus, it is important to define, as precisely as possible, a group of women at high risk of ER-positive breast cancer. Most attempts at defining a high risk for breast cancer have focused on family history, which typically has an attributable risk of 7%; however, breast density of more than 50%, as assessed radiologically, has a greater population attributable risk of approximately 30% (3–5). In addition, breast density is increased by hormone replacement therapy and presumably affected by other hormonal stimuli (6). Tamoxifen also reduces mammographic breast density in women already diagnosed with breast cancer (7). Thus, the reduction in breast cancer incidence found with prophylactic tamoxifen may be at least partly explained by its effect on breast density, and monitoring breast density in an individual woman may indicate whether antiestrogenic interventions such as tamoxifen are likely to be effective for that woman. Further investigation of the relationship between tamoxifen and breast density, particularly in women who have not yet developed breast cancer is therefore of great interest. If changes in breast density were shown to correspond to changes in breast cancer risk, then breast density might be a useful surrogate end point in future prevention trials. Such a finding may also increase our understanding of the biology of breast cancer and its causes and may contribute to new preventive strategies.
During the International Breast Cancer Intervention Study I (IBIS-I), a trial of tamoxifen for breast cancer prevention, mammograms were obtained from all subjects at baseline and every 18 months during treatment. Although these mammograms were performed for screening purposes, they also documented changes in mammographic breast density during the course of treatment. In this study, we investigated the influence of tamoxifen treatment and other hormonal factors, family history of breast cancer, and anthropometric measures on mammographic density at baseline and during treatment in a subset of 818 healthy women at high risk of breast cancer from the IBIS-I chemoprevention trial. The important question of whether changes in density predict changes in risk is not addressed in this study but will be the subject of a later report.
Subjects and Methods
The IBIS-I trial was initiated in 1992 to determine whether tamoxifen could prevent breast cancer in healthy women at high risk of developing the disease. To be eligible, a woman had to be aged 35–70 years with at least twice the population risk of developing breast cancer (1). The incidence of breast cancer in the placebo arm was 6.7 per 1000 person-years compared with a population risk for this age group of approximately 2.5 per 1000 person-years. Breast cancer risk was assessed by interview and was based primarily on a family history of breast cancer or proliferative benign breast disease. The 7152 healthy women who satisfied the eligibility criteria were randomly assigned to take either tamoxifen (20 mg/day) or placebo for 5 years (n = 3578 and 3574 women, respectively) in a double-blind fashion. Initial results on reduction in the incidence of breast cancer have recently been reported (1).
Baseline mammograms were required before randomization for all women. Additional mammograms were scheduled for 18, 36, and 54 months later and were read locally by radiologists at the participating centers. The primary aim of the mammography was early detection of breast cancer, so the quantitative assessments of breast density needed for this analysis were not immediately available. Mammograms from the eight largest recruiting centers were retrieved for density reading by a single consultant radiologist (R. M. L. Warren) and were digitized for future studies. The centers were in Aberdeen, Bristol, Cardiff, Edinburgh, London, Manchester, Nottingham, and Southampton. To be eligible for this study, women needed to have baseline, 18-month, and 54-month mammograms and be in full compliance with study medication. About 35% of the subjects were not eligible because their baseline mammographic examination was no longer available (usually because the screening service had destroyed it). We analyzed data from all 818 women (388 in the tamoxifen group and 430 in the placebo group; test for imbalance, P = .14) from these centers who were free of breast cancer at the completion of treatment and who satisfied the above criteria. Written informed consent to use mammograms and medical records for research on breast cancer risk factors was obtained from each subject, and local ethics committee approval was obtained from all participating centers.
Mammographic breast density was assessed visually by a consultant radiologist (R. M. L. Warren) and classified according to the criteria set out by Wolfe (8), Boyd et al. (9), and Gram et al. (10). The proportion of the breast composed of dense tissue, termed breast density, was also estimated and expressed as a percentage of total breast area (to the nearest 5%). Thus, in effect, a 21-point categorical scale was used. In this report, we used only the raw percent density and the Boyd classification scale (6), which categorizes percent density into the following groups: A = 0%, B = 1%–10%, C = 11%–25%, D = 26%–50%, E = 51%–75%, and F = 76%–100%. The mammograms for each woman were sorted by date and were read in batches for 20 women at a time. The mammograms for each woman were viewed consecutively, commencing with the baseline film, in sessions lasting approximately 40 minutes per batch. This mammographic examination reading was done without knowledge of treatment group or other potential predictive factors. To assess the reproducibility of these readings, a subset of mammograms from approximately 70 women from Manchester were read separately by a specially trained research nurse (E. Pinney). The two sets of readings showed very good agreement, with correlation coefficients of .91 for the baseline readings, .88 for readings at 18 months, and .74 for readings at 54 months. There was a substantial difference in opinion in only one case, which resulted from an underexposed film. Measures of the change in density over the first 18 and 54 months of treatment also showed good correlation between readers (ρ = .66 and ρ = .89, respectively).
Statistical Analysis
Breast density was not normally distributed. The distribution was bimodal with observations being concentrated around 0 and Boyd class E (51%–75% dense). Breast density was also not a truly continuous variable because it was measured on a 21-point scale quantized by 5% increments in density. Because we were primarily interested in the effect of tamoxifen on reduction in breast density, we excluded women with baseline densities at or below 10% at entry from those analyses involving changes in breast density.
The univariate and multivariable logistic regression analyses examined associations between baseline breast density [dichotomized into breast density groups of <50% or ≥50% (4)] and age at first birth, body mass index, age at entry to the study, age at menarche, menopausal status at entry, predicted familial relative risk (RR) of developing breast cancer within the next 10 years, history of previous breast biopsy, history of benign breast disease (proliferative disease with or without atypical hyperplasia), hormone replacement therapy use, and smoking status. The predicted familial relative risk of death from breast cancer within 10 years (relative to the corresponding population risk) was calculated with a model for predicting individual breast cancer risk developed by Tyrer et al. (11) and divided into three categories: low (RR ≤2), moderate (RR from >2 to ≤3), and high (RR >3). The importance of each variable was assessed with the likelihood ratio test (deviance) in univariate and multivariable models. We also investigated whether the absolute change in breast density (between entry and the end of the trial) was related to the above variables (including treatment group) by use of linear regression. In this case, model fit was assessed quantitatively with the r2 measure (i.e., the proportion of the variation in the data explained by the model) and visually with appropriate residual plots. This analysis was repeated with an adjustment for breast density at the start of the trial.
A series of Student’s t tests were carried out to investigate whether the magnitude and strength of the tamoxifen effect on breast density varied for specific subgroups of women. All statistical tests were two-sided.
Results
Baseline hormonal, familial, and anthropometric characteristics of all 818 subjects, by treatment group, were well balanced between treatment arms (Table 1). Details of the number of subjects in each treatment group by Boyd scale at baseline and at the end of the study are given in Table 2. The mean breast density at baseline was 42.6% (95% CI = 39.6% to 45.6%) for the placebo group and 41.9% (95% CI = 38.8% to 45.0%) for the tamoxifen group. By the 18-month follow-up mammogram, breast density had fallen to 39.1% (decrease from baseline = 3.5%, 95% CI = 2.7% to 4.3%; P<.001) in the placebo group and 34.0% (decrease from baseline = 7.9%, 95% CI = 6.9% to 8.9%; P<.001) in the tamoxifen group, statistically significant differences. After approximately 54 months of treatment, breast density was 28.2% in the tamoxifen group (decrease from baseline = 13.7%, 95% CI = 12.3% to 15.1%; P<.001) and 35.3% in the placebo group (decrease from baseline = 7.3%, 95% CI = 6.1% to 8.4%; P<.001) (Fig. 1). Thus, the mean breast density for both tamoxifen and placebo groups fell over the entire course of the study, but the reductions were greater in the tamoxifen group than in the placebo group (P<.001).
Increases in breast density were rare and generally small. A large increase in breast density (e.g., moving up two Boyd categories) was observed in only two women, both of whom were in the placebo group and were taking hormone replacement therapy throughout the study period.
The expected reduction in breast cancer risk associated with the density reduction was estimated for the tamoxifen arm. The relative risk of 1.43 per density category observed by Boyd et al. (9) corresponds to a relative risk of 1.018 per percentage point of breast density. Thus, if we assume that the cross-sectional data apply to changes in density, an additional 6% reduction in density with tamoxifen would predict an 11% reduction in breast cancer risk in the tamoxifen arm. Use of individual relative risks for each Boyd category (9) gave a similar reduction.
The results from the univariate and multivariable logistic regression models for breast density at entry to the trial are summarized in Table 3. Body mass index, age at entry to the trial, menopausal status, predicted familial relative risk of developing breast cancer by the Cuzick–Tyrer method (11), previous breast biopsy examination, and smoking status were statistically significant variables in the univariate and multivariable models. Body mass index is inversely related to the risk of having high breast density (in the 25.01–30 kg/m2 category, odds ratio [OR] = 0.40, 95% CI = 0.27 to 0.61; in the >30 kg/m2 category, OR = 0.22, 95% CI = 0.14 to 0.35). Age at entry had an independent effect that, even after adjusting for menopausal status, was particularly apparent for women older than 55 years whose breast densities were substantially lower than those of younger postmenopausal women. Surprisingly, women with the highest predicted familial relative risk of developing breast cancer were less likely to have high breast density than those with low-to-moderate predicted risks. We also found that high breast density was less common in current (OR = 0.60, 95% CI = 0.40 to 0.91) and former (OR = 0.79, 95% CI = 0.56 to 1.13) smokers compared with never smokers, which has been observed before and is in keeping with the known antiestrogenic action of smoking (13). A history of breast biopsy examination was associated with increased breast density. This result was strongly influenced by women with atypical hyperplasia (OR = 20.2, 95% CI = 2.35 to 174; P = .006), but women with nonproliferative benign breast disease (OR = 1.88, 95% CI = 1.23 to 2.77) or proliferative disease without atypical hyperplasia (OR = 1.56, 95% CI = 0.65 to 3.73) have a moderately increased risk of high breast density as well.
Results from the linear regression models examining the association between breast cancer risk factors and the change in breast density during the trial (54 months from entry) for women with baseline density above 10% are given in Table 4. A positive coefficient indicates that the given variable category is associated with a greater decrease in breast density than the baseline category. The largest effect is associated with taking tamoxifen, where the mean reduction in breast density was 7.75% (P<.001). Smaller reductions in breast density and a smaller effect of tamoxifen were associated with postmenopausal status than with premenopausal status (Table 4 and Fig. 3). The effect of tamoxifen treatment on breast density varied little between the univariate and multivariable models, suggesting that this effect is robust.
Results from the multivariable analysis indicate that a body mass index of 25 kg/m2 or less, stopping hormone replacement therapy during the study, and smoking during the study were also associated with the greater reductions in breast density. Smoking was associated with low breast density at entry and a greater reduction in density during the study period. This observation may be attributable to the ongoing antiestrogenic effect of smoking during the study period. A model was also constructed by adding baseline density to the variables. Breast density at entry to the trial had a statistically significant effect on the change in density (P<.001). In this model, body mass index was no longer statistically significantly associated with breast density, but other coefficients, including the effect of tamoxifen, were essentially unchanged.
Additional Student’s t tests were carried out to determine whether the observed effects of tamoxifen on density applied equally to all subgroups of women. Estimates of the mean reduction in breast density with tamoxifen in different subgroups and the corresponding confidence intervals are shown in Fig. 3. In all cases, tamoxifen treatment was associated with reductions in density, but such reductions tended to be smaller in older and postmenopausal women. The interaction of breast density with age was statistically significant (P<.001). In women aged 45 years or younger at entry, the net reduction with tamoxifen was 13.4% (95% CI = 8.6% to 18.1%), whereas in women older than 55 years, it was 1.1% (95% CI = −3.0% to 5.1%). The differences in breast density associated with other subgroups showed no consistent patterns.
Although the identified breast cancer risk factors appear to have a clear influence on breast density, their inclusion in the multivariable model jointly account for just 17% of the total variation in the baseline density. It therefore seems likely that other unknown factors also influence breast density.
Discussion
In women whose initial breast density was greater than 10%, we found an average reduction in breast density, in addition to that attributable to aging, of about 8% after approximately 5 years of tamoxifen use. The reduction was greater in younger premenopausal women and in women with a low body mass index for whom baseline breast density values were typically higher. The reduction associated with tamoxifen remained highly statistically significant after adjustment for other variables predictive of breast density, and the reduction was greater than that of any of the other factors examined. These results are consistent with previous findings that tamoxifen reduces breast density in women with breast cancer (7) and with the observations that reduced breast density is associated with other antiestrogenic stimuli such as isoflavones (14–15), and increased breast density is associated with hormone replacement therapy (6).
Postmenopausal status, increased age, and smoking status were associated with lower breast density, a result consistent with the effects of these variables on estrogen levels (13,15,16). In keeping with other reports (17), we also observed reduced density in women with a high body mass index, which is probably the result of greater fatty replacement in breasts of women with more adipose tissue. An unexpected observation was the association between a high familial risk of developing breast cancer within the next 10 years and a lower breast density (P = .02), which was not lost when adjustments for other factors were made in the multivariable model. High breast density was associated more strongly with a familial risk of breast cancer in the lowest tertile than with a familial risk of breast cancer in the highest tertile (OR = 0.45, 95% CI = 0.25 to 0.80; P = .006). This result is surprising because a family history of breast cancer and high breast density are well established risk factors for developing breast cancer and because dense breasts are often observed in women with BRCA1 mutations (18). It is possible that women with a family history of breast cancer may develop cancer by a different molecular pathway (e.g., ER-negative tumors in BRCA1 cancers) that is unrelated to breast density (19,20) or to estrogen levels. This hypothesis is highly speculative, however, and these results require further confirmation.
The increase in density associated with a previous biopsy is consistent with the increased risk of breast cancer associated with such a history, especially because the highest densities were found in women with atypical hyperplasia (21,22). Women with atypia had a relatively large drop in density on follow-up, but there was no apparent interaction with tamoxifen.
The association of density with other risk factors for breast cancer, notably age at menarche and age at first birth, was less marked in our study than in other studies (some of which were larger than our study) that looked at a population at normal risk for breast cancer (10,15). The lack of association in our study may be the result of insufficient power. Age at menarche showed no association with breast density at baseline, but the reduction in density was greater in women who underwent menarche when younger than 13 years.
The marked reduction in breast density associated with tamoxifen treatment is of particular interest for future chemoprevention studies. It also provides justification for the use of breast density as an entry criterion for breast cancer chemoprevention trials (23). The marked reduction in breast density associated with tamoxifen treatment also suggests the possibility of using a change in breast density as an intermediate or surrogate end point for breast cancer in chemoprevention trials. Our results indicate that approximately two-thirds of the total reduction in breast density attained with tamoxifen over the 5-year period occurred within the first 18 months, which suggests that breast density may be a potential early marker of efficacy. It may be that failure of a chemopreventive agent to change breast density will provide an early indication that the preventive strategy for the women in question is not effective. However, the change in density associated with tamoxifen predicted only one-third of the reduction in the incidence of breast cancer seen in the prevention trials, suggesting that tamoxifen has additional preventive activity not reflected in its effect on breast density.
The observed changes in breast density associated with tamoxifen were greatest in women who were premenopausal at entry. Premenopausal estrogen levels are higher, so the relative antiestrogenic effect of tamoxifen is greater, thus explaining its effect on density. However, the prevention trials indicate that the ability of tamoxifen to reduce breast cancer risk appears to be independent of age (2), so the clinical significance of greater reductions in breast density in younger women is unclear. They may be related to bringing about an earlier menopause or may not be permanent. Further studies are needed to establish whether breast density reverts to its age-specific population level after cessation of tamoxifen treatment.
Two important questions remain to be answered: First, is the effect of tamoxifen on breast density reversed when treatment stops? Second, is the tamoxifen-induced reduction in density associated with a reduction in breast cancer risk at the individual level? Both of these questions are the subject of ongoing research, the first by determining the mammographic density 1–2 years after the completion of treatment and the second by use of a nested case–control study within IBIS-I.
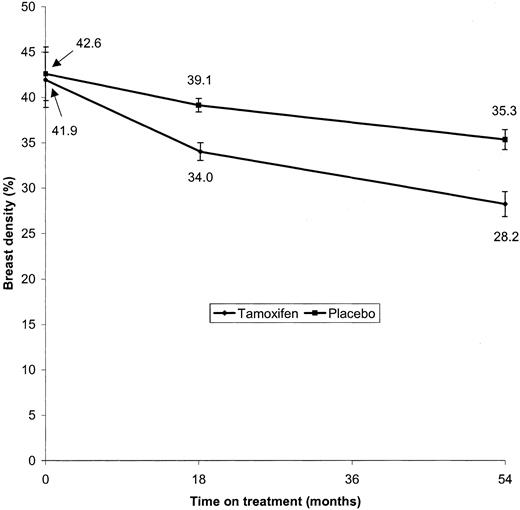
Mean breast density at baseline, 18 months later, and 54 months later by treatment group. Significance levels for the difference (in terms of reduction in breast density from baseline) between the treatment groups are P<.001 at 18 months and P<.001 at 54 months. The 95% confidence intervals for follow-up are for differences from baseline. All statistical tests were two-sided.
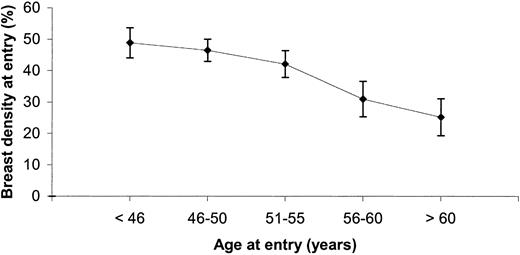
Mean breast density at entry to the study and 95% confidence intervals, by age group.
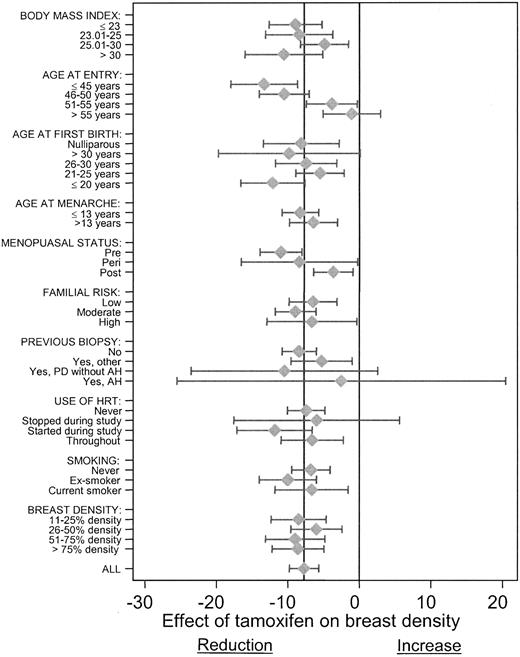
Mean change in breast density (95% confidence intervals) with tamoxifen (measured from baseline to 54 months) in subgroups of other risk factors (n = 641 women with baseline breast density of >10%). Negative values reflect decreased breast density; positive values reflect increased breast density. “All” represents overall unstratified reduction in percent density with tamoxifen. PD = proliferative breast disease; AH = atypical hyperplasia; HRT = hormone replacement therapy.
Baseline characteristics of women in the tamoxifen and placebo groups
| Variable | Tamoxifen, No. (%) | Placebo, No. (%) |
|---|---|---|
| Total | 388 | 430 |
| Body mass index, kg/m2 | ||
| ≤23 | 93 (24) | 94 (22) |
| 23.01–25 | 71 (18) | 87 (20) |
| 25.01–30 | 126 (33) | 154 (36) |
| >30 | 98 (25) | 95 (22) |
| Age at entry, y | ||
| ≤45 | 75 (19) | 76 (18) |
| 46–50 | 135 (35) | 168 (39) |
| 51–55 | 98 (25) | 106 (25) |
| 56–60 | 42 (11) | 53 (12) |
| >60 | 38 (10) | 27 (6) |
| Age at first birth, y | ||
| Nulliparous | 57 (15) | 51 (12) |
| ≥30 | 69 (18) | 77 (18) |
| 26–30 | 155 (40) | 165 (38) |
| 21–25 | 88 (23) | 100 (23) |
| ≤20 | 19 (5) | 37 (9) |
| Age at menarche, y | ||
| ≤13 | 258 (66) | 272 (63) |
| >13 | 130 (34) | 158 (37) |
| Menopausal status at entry | ||
| Premenopausal | 191 (49) | 209 (49) |
| Perimenopausal | 18 (5) | 24 (5) |
| Postmenopausal | 179 (46) | 197 (46) |
| Predicted familial risk | ||
| Low (less than or equal to twofold) | 160 (41) | 172 (40) |
| Moderate (twofold to threefold) | 187 (48) | 216 (50) |
| High (greater than threefold) | 41 (11) | 42 (10) |
| Previous biopsy (history of benign disease) | ||
| No | 292 (75) | 325 (76) |
| Yes | ||
| Proliferative disease (without atypical hyperplasia) | 12 (3) | 16 (4) |
| Proliferative disease (with atypical hyperplasia) | 7 (2) | 6 (1) |
| Other (no proliferative disease) | 77 (20) | 83 (19) |
| Use of hormone replacement therapy | ||
| Never | 241 (62) | 266 (62) |
| Stopped during study | 19 (5) | 30 (7) |
| Started during study | 61 (16) | 53 (12) |
| Throughout study | 67 (17) | 81 (19) |
| Smoking status | ||
| Never | 198 (51) | 227 (53) |
| Former | 121 (31) | 117 (27) |
| Current | 69 (18) | 86 (20) |
Cross tabulation of number of women in each Boyd category at entry to the study with category after 54 months of treatment, by treatment group*
| Boyd category at entry to study | No. of women | |||||||||||||
|---|---|---|---|---|---|---|---|---|---|---|---|---|---|---|
| Boyd category after 54 mo. of treatment | Total (%) | |||||||||||||
| A | B | C | D | E | F | |||||||||
| Placebo group | ||||||||||||||
| A | 48 | 5 | 1 | 0 | 0 | 0 | 54 (13) | |||||||
| B | 9 | 32 | 3 | 1 | 0 | 0 | 45 (10) | |||||||
| C | 3 | 11 | 30 | 7 | 0 | 0 | 51 (12) | |||||||
| D | 0 | 5 | 34 | 46 | 5 | 0 | 90 (21) | |||||||
| E | 0 | 1 | 8 | 33 | 56 | 2 | 100 (23) | |||||||
| F | 0 | 0 | 0 | 4 | 42 | 44 | 90 (21) | |||||||
| Total (%) | 60 (14) | 54 (13) | 76 (18) | 91 (21) | 103 (24) | 46 (11) | 430 (100) | |||||||
| Tamoxifen group | ||||||||||||||
| A | 45 | 2 | 0 | 0 | 0 | 0 | 47 (12) | |||||||
| B | 18 | 12 | 1 | 0 | 0 | 0 | 31 (8) | |||||||
| C | 10 | 19 | 19 | 2 | 0 | 0 | 50 (13) | |||||||
| D | 5 | 12 | 36 | 44 | 0 | 0 | 97 (25) | |||||||
| E | 0 | 2 | 17 | 43 | 27 | 0 | 89 (23) | |||||||
| F | 0 | 1 | 1 | 9 | 46 | 17 | 74 (19) | |||||||
| Total (%) | 78 (20) | 48 (12) | 74 (19) | 98 (25) | 73 (19) | 17 (4) | 388 (100) | |||||||
Boyd category is defined as percent of area of the breast on the mammogram that is composed of dense tissue: A = 0%; B = 1%–10%; C = 11%–25%; D = 26%–50%; E = 51%–75%; F = 76%–100%.
Odds ratio (OR) estimates of relative risk of high breast density (≥50% dense) at entry to the study for various risk factors from the univariate and multivariable logistic regression models*
| Variable | No. | Mean percent density at baseline | Univariate OR | Multivariable OR (95% CI) |
|---|---|---|---|---|
| Body mass index, kg/m2 | ||||
| ≤23 | 187 | 58.33 | (Referent) | (Referent) |
| 23.01–25 | 158 | 50.56 | 0.65 | 0.69 (0.43 to 1.10) |
| 25.01–30 | 280 | 38.15 | 0.36 | 0.40 (0.27 to 0.61) |
| >30 | 193 | 25.91 | 0.22 | 0.22 (0.14 to 0.35) |
| Ptrend | <.001 | |||
| Age at entry, y | ||||
| ≤45 | 151 | 48.81 | (Referent) | (Referent) |
| 46–50 | 303 | 46.43 | 1.24 | 1.21 (0.77 to 1.90) |
| 51–55 | 204 | 42.02 | 0.76 | 0.81 (0.47 to 1.38) |
| >55 | 160 | 28.53 | 0.27 | 0.32 (0.17 to 0.62) |
| Ptrend | .001 | |||
| Age at first birth, y | ||||
| Nulliparous | 108 | 49.17 | (Referent) | - |
| >30 | 56 | 40.59 | 0.90 | - |
| 26–30 | 188 | 44.95 | 0.80 | - |
| 21–25 | 320 | 40.48 | 0.74 | - |
| ≤20 | 146 | 38.29 | 0.71 | - |
| Age at menarche, y | ||||
| ≤13 | 530 | 41.76 | (Referent) | - |
| >13 | 288 | 43.22 | 0.99 | - |
| Menopausal status at entry | ||||
| Premenopausal | 400 | 48.25 | (Referent) | (Referent) |
| Perimenopausal | 42 | 47.40 | 1.00 | 0.80 (0.40 to 1.63) |
| Postmenopausal | 376 | 35.34 | 0.42 | 0.57 (0.38 to 0.85) |
| Ptrend | .003 | |||
| Predicted familial risk | ||||
| Low | 332 | 43.11 | (Referent) | (Referent) |
| Moderate | 403 | 42.77 | 0.95 | 1.06 (0.76 to 1.46) |
| High | 83 | 36.47 | 0.59 | 0.45 (0.25 to 0.80) |
| Ptrend | .02 | |||
| Previous biopsy (history of benign disease) | ||||
| No | 617 | 39.86 | (Referent) | (Referent) |
| Yes | ||||
| Other (no proliferative disease) | 160 | 48.74 | 1.59 | 1.88 (1.23 to 2.77) |
| Proliferative disease (without atypical | 28 | 44.82 | 1.40 | 1.56 (0.65 to 3.73) |
| hyperplasia) | ||||
| Atypical hyperplasia | 13 | 71.38 | 16.8 | 20.2 (2.35 to 174) |
| Ptrend | <.001 | |||
| Use of hormone replacement therapy | ||||
| Never | 507 | 42.15 | (Referent) | - |
| Stopped during study | 49 | 36.04 | 1.20 | - |
| Started during study | 114 | 47.23 | 1.30 | - |
| Throughout study | 148 | 40.93 | 0.88 | - |
| Smoking status | ||||
| Never | 425 | 44.91 | (Referent) | (Referent) |
| Former | 238 | 39.65 | 0.89 | 0.79 (0.56 to 1.13) |
| Current | 155 | 39.06 | 0.70 | 0.60 (0.40 to 0.91) |
| Ptrend | .03 |
All variables were considered for inclusion in the multivariable model. Missing entries indicate no statistically significant effect in the multivariable model. All statistical tests were two-sided. CI = confidence interval; - = data not available.
Estimated change in breast density from the univariate and multivariable regression models for breast cancer risk factors from 641 women with baseline breast density of >10%*
| Variable | Univariate model | Multivariable model | Ptrend | ||||
|---|---|---|---|---|---|---|---|
| Estimated reduction in percent density | Difference in percent density from reference category | Estimated reduction in percent density | Difference in percent density from reference category (95% CI) | ||||
| Treatment | |||||||
| Placebo | 9.76 | (Referent) | 13.75 | (Referent) | |||
| Tamoxifen | 17.51 | 7.75 | 21.59 | 7.84 (5.85 to 9.82) | <.001 | ||
| Body mass index, kg/m2 | |||||||
| ≤23 | 14.78 | (Referent) | 13.75 | (Referent) | |||
| 23.01–25 | 14.70 | −0.08 | 13.97 | 0.64 (−2.19 to 3.46) | |||
| 25.01–30 | 12.16 | −2.62 | 11.75 | −2.00 (−4.54 to 0.53) | |||
| >30 | 12.39 | −2.39 | 10.76 | −2.99 (−6.07 to −0.09) | .002 | ||
| Age at entry, y | |||||||
| ≤45 | 14.28 | (Referent) | – | – | |||
| 46–50 | 16.27 | 1.94 | – | – | |||
| 51–55 | 12.42 | −1.87 | – | – | |||
| >56 | 7.84 | −6.44 | – | – | – | ||
| Age at first birth, y | |||||||
| Nulliparous | 13.12 | (Referent) | – | – | |||
| >30 | 11.28 | −1.84 | – | – | |||
| 26–30 | 13.17 | 0.05 | – | – | |||
| 21–25 | 14.29 | 1.17 | – | – | |||
| ≤20 | 13.21 | 0.08 | – | – | – | ||
| Age at menarche, y | |||||||
| ≤13 | 14.75 | (Referent) | 13.75 | (Referent) | |||
| >13 | 11.24 | −3.52 | 10.94 | −2.81 (−4.89 to −0.73) | .008 | ||
| Menopausal status at entry | |||||||
| Premenopausal | 16.05 | (Referent) | 13.75 | (Referent) | |||
| Perimenopausal | 15.16 | −0.89 | 13.37 | −0.38 (−4.94 to 4.17) | |||
| Postmenopausal | 10.01 | −6.04 | 8.56 | −5.59 (−7.81 to −3.37) | <.001 | ||
| Predicted familial risk | |||||||
| Low | 13.65 | (Referent) | – | – | |||
| Moderate | 13.82 | 0.17 | – | – | |||
| High | 10.95 | −2.70 | – | – | – | ||
| Previous biopsy† | |||||||
| No | 13.48 | (Referent) | – | – | |||
| Yes | |||||||
| Other (no proliferative disease) | 12.86 | −0.62 | – | – | |||
| Proliferative disease (without atypical hyperplasia) | 15.00 | 1.52 | – | – | |||
| Atypical hyperplasia | 17.50 | 4.02 | – | – | – | ||
| Use of hormone replacement therapy | |||||||
| Never | 14.14 | (Referent) | 13.75 | (Referent) | |||
| Stopped during study | 16.50 | 2.36 | 17.55 | 3.80 (−0.98 to 8.57) | |||
| Started during study | 14.22 | 0.09 | 11.87 | −1.88 (−4.79 to 1.02) | |||
| Throughout study | 9.77 | −4.36 | 11.50 | −2.25 (−5.02 to 0.53) | .07 | ||
| Smoking status | |||||||
| Never | 12.28 | (Referent) | 13.75 | (Referent) | |||
| Former | 13.99 | 1.71 | 14.68 | 0.93 (−1.40 to 3.25) | |||
| Current | 16.28 | 4.00 | 17.11 | 3.36 (0.65 to 6.06) | .005 | ||
| Baseline density, Boyd category‡ | |||||||
| C | 5.63 | (Referent) | – | – | |||
| D | 12.24 | 6.61 | – | – | |||
| E | 17.78 | 12.15 | – | – | |||
| F | 14.40 | 8.77 | – | – | – | ||
CI = confidence interval; - = data not available.
History of benign disease.
Not considered for inclusion in the multivariable model; Boyd category is defined as percent of the area of the breast on the mammogram that is composed of dense tissue: A = 0%; B = 1%–10%; C = 11%–25%; D = 26%–50%; E = 51%–75%; F = 76%–100%. All other variables were considered for inclusion in the multivariable model. Missing entries indicate no statistically significant effect in the multivariable model. All statistical tests were two-sided.
Editor’s note: Dr. J. Cuzick is a statistical consultant for AstraZeneca, the maker of tamoxifen.
We thank the following IBIS investigators and local staff at participating centers for their time and assistance in obtaining the mammograms for this study: Fiona Gilbert, Heather Deans, Elspeth Singleton, Linda Gunn, and Moira Ayrton (Grampian Primary Care NHS Trust, Aberdeen); Simon Cawthorn, Nicola Slack, Ruth Illingworth, and Bernadette Thompson (Frenchay Hospital, Bristol); Dorothy Goddard (Royal United Hospital, Bath); Liz Kutt (Bristol Royal Infirmary, Bristol); Robert Mansel, Kathleen Lyons, Amanda Pickersgill, and Samantha Morris (University Hospital Wales, Cardiff); Elaine Anderson, Lesley Smart, and Sarah Drummond (Scottish Breast Screening Programme, Edinburgh); Hisham Hamed, Sheila Rankin, and Diane Ridley (Guy’s Hospital, London); Anthony Howell, Caroline Boggis, Mary Wilson, and Louise Harrop (Nightingale Breast Centre, Manchester); Roger Blamey, John Robertson, Robin Wilson, Nicky Scott, and Kay James (City Hospital, Nottingham) and Diana Eccles, Mary Briley, and Mary Cross (Royal South Hants Hospital, Southampton).
We also thank Natasha Warsi for her help with the collection and digitizing of mammograms, and we gratefully acknowledge the women who have participated in the IBIS-I trial, without whom none of this would be possible.
References
Cuzick J, Forbes J, Edwards R, Baum M, Cawthorn S, Coates A, et al. First results from the International Breast Cancer Intervention Study (IBIS-I): a randomised prevention trial.
Cuzick J, Powles T, Veronesi U, Forbes J, Edwards R, Ashley S, et al. Overview of the main outcomes in breast-cancer prevention trials.
Warner E, Lockwood G, Tritchler D, Boyd NF. The risk of breast cancer associated with mammographic parenchymal patterns: a meta-analysis of the published literature to examine the effect of method of classification.
Byng JW, Yaffe MJ, Jong RA, Shumak RS, Lockwood GA, Tritchler DL, et al. Analysis of mammographic density and breast cancer risk from digitized mammograms.
Hemminki K, Granstrom C, Czene K. Attributable risks for familial breast cancer by proband status and morphology: a nationwide epidemiologic study in Sweden.
Greendale GA, Reboussin BA, Slone S, Wasilauskas C, Pike MC, Ursin G. Postmenopausal hormone therapy and change in mammographic density.
Atkinson C, Warren R, Bingham SA, Day NE. Mammographic patterns as a predictive biomarker of breast cancer risk: effect of tamoxifen.
Wolfe JN. Breast patterns as an index of risk for developing breast cancer.
Boyd NF, Byng JW, Jong RA, Fishell EK, Little LE, Miller AB, et al. Quantitative classification of mammographic densities and breast cancer risk: results from the Canadian national breast screening study.
Gram IT, Funkhouser E, Tabar L. The Tabar classification of mammographic parenchymal patterns.
Tyrer J, Duffy SW, Cuzick J. A breast cancer prediction model incorporating familial and personal risk factors.
Ursin G, Ma H, Wu AH, Berstein L, Salane M, Parisky Y, et al. Mammographic density and breast cancer in three ethnic groups.
Sala E, Warren RM, McCann J, Duffy SW, Luben R, Day NE. Smoking and high-risk mammographic parenchymal patterns.
Atkinson C, Bingham SA. Mammographic breast density as a biomarker of effects of isoflavones on the female breast.
Jakes RW, Duffy SW, Ng FC, Gao F, Ng EH, Seow A, et al. Mammographic parenchymal patterns and self-reported soy intake in Singapore Chinese women.
Duffy SW, Tabar L, Smith RA, Krusemo UB, Prevost TC, Chen HH. Risk of breast cancer and risks with breast cancer; the relationship between histologic type with epidemiology, disease progression and survival.
Sala E, Warren R, McCann J, Duffy S, Luben R, Day N. High-risk mammographic parenchymal patterns and anthropometric measures: a case-control study.
Huo Z, Giger ML, Olopade OI, Wolverton DE, Weber BL, Metz CE, et al. Computerized analysis of digitized mammograms of BRCA1 and BRCA2 gene mutation carriers.
Pankow J, Vachon C, Kuni C, King R, Arnett D, Grabrick D, et al. Genetic analysis of mammographic breast density in adult women: evidence of a gene effect.
Boyd N, Dite G, Stone J, Gunasekara A, English D, McCredie M, et al. Heritability of mammographic density, a risk factor for breast cancer.
Dupont WD, Page DL. Risk factors for breast cancer in women with proliferative breast disease.
Page DL, Dupont WD. Indicators of increased breast cancer risk in humans.

