


Abstract
Background: AIB1 (SRC-3) is an estrogen receptor (ER) coactivator that, when overexpressed in cultured cells, can reduce the antagonist activity of tamoxifen-bound ERs. Signaling through the HER-2 receptor pathway activates AIB1 by phosphorylation. To determine whether high AIB1 expression alone or together with HER-2 reduces the effectiveness of tamoxifen in breast cancer patients, we quantified expression of AIB1 and HER-2 in tumors from breast cancer patients with long-term clinical follow-up who received either no adjuvant therapy or adjuvant tamoxifen therapy after breast cancer surgery. Methods: AIB1 and HER-2 protein levels in tumors from 316 breast cancer patients were determined using western blot analysis. Molecular variables (e.g., expression of AIB1, ER, progesterone receptor, p53, Bcl-2), tumor characteristics, and patient outcome were assessed using Spearman rank correlation. Disease-free survival (DFS) curves were derived from Kaplan–Meier estimates, and the curves were compared by log-rank tests. The effect of AIB1 on DFS adjusted for other prognostic factors was assessed by multivariable analysis using the Cox proportional hazards model. All statistical tests were two-sided. Results: High AIB1 expression in patients not receiving adjuvant tamoxifen therapy was associated with better prognosis and longer DFS (P = .018, log-rank test). In contrast, for patients who did receive tamoxifen therapy, high AIB1 expression was associated with worse DFS (P = .049, log-rank test), which is indicative of tamoxifen resistance. The test for interaction between AIB1 expression and tamoxifen therapy was statistically significant (P = .004). When expression of AIB1 and HER-2 were considered together, patients whose tumors expressed high levels of both AIB1 and HER-2 had worse outcomes with tamoxifen therapy than all other patients combined (P = .002, log-rank test). Conclusions: The antitumor activity of tamoxifen in patients with breast cancer may be determined, in part, by tumor levels of AIB1 and HER-2. Thus, AIB1 may be an important diagnostic and therapeutic target.
The estrogen receptor (ER) mediates the effects of estrogen on the development and progression of breast cancer, and it serves as an important diagnostic and therapeutic target for prevention and treatment. The ER regulates the expression of genes that contribute to tumor progression by both classical (e.g., binding to specific response elements in a gene promoter) and nonclassical (e.g., activating growth factor pathways in the membrane) mechanisms. The selective estrogen receptor modulator (SERM) drug tamoxifen, which binds to the ER and partially inhibits its activity, is effective in the treatment and prevention of breast cancer.
ER-mediated gene transcription is regulated not only by the binding of estrogens or SERMs to the ER but also by other post-translational events, such as receptor phosphorylation, which can be induced both by the binding of estrogen and SERMs and by mitogen-activated protein kinase (MAPK) pathways (1–6). ER function is also modulated by interactions with coactivators and corepressors (7). These coregulatory proteins may also alter ER activity when the receptor is bound by SERMs such as tamoxifen, a drug that has mixed estrogen agonist/antagonist properties. Increased coactivator levels can enhance the agonist activity of tamoxifen-bound ER, whereas increased corepressor levels can enhance antagonist activity, at least in cultured cells, in which the levels of these proteins can be raised or lowered dramatically (8–12).
AIB1, also called SRC-3, RAC3, ACTR, and p/CIP, is an ER coactivator that is thought to be important in breast cancer (13–16). AIB1 is overexpressed in breast cancer cells compared with normal duct epithelial cells and is amplified in a small proportion of breast tumors (13,17–19). AIB1 is highly expressed in cultured MCF-7 human breast cancer cells, and its activity is essential for the growth of these cells both in vitro and in vivo (20). AIB1, like the ER itself, is phosphorylated and thereby functionally activated by MAPKs; therefore, high levels of activated AIB1 could reduce the antagonist effects of tamoxifen, especially in tumors that also overexpress the HER-2 receptor, a member of the epidermal growth factor (EGF) receptor family that activates MAPKs (21).
Laboratory studies suggest that ER-positive breast cancers that overexpress HER-2 may be less responsive to tamoxifen than breast cancers with low HER-2 expression (22). The mechanisms for this resistance are not yet clear; however, ligand-independent activation of the ER by MAPKs, which themselves are phosphorylated and thereby activated by HER-2 signaling in such tumors, may contribute to it (4–6). High HER-2 expression has also been shown to be associated with tamoxifen resistance in some clinical studies (23,24), but this association is not strong and other studies have failed to confirm it (23,24).
The cumulative data on the role of coregulators in ER function suggest that they are important contributors to estrogen-mediated tumor growth and, potentially, to breast tumor sensitivity or resistance to endocrine therapy such as tamoxifen. Tumors with a relatively high abundance of coactivators such as AIB1, especially those with enhanced HER-2 signaling which can activate AIB1, should be less responsive to tamoxifen therapy because of increased estrogen agonist activity of tamoxifen-bound ER (12,25). To explore these hypotheses, we determined AIB1 protein levels in extracts from frozen tumors from 316 patients with long-term clinical follow-up, some of whom had received no adjuvant systemic therapy after breast cancer surgery and others of whom had received adjuvant tamoxifen therapy. Correlations among expression levels of AIB1 and other molecular variables, including ER, progesterone receptor (PR), HER-2, p53, and Bcl-2, and tumor characteristics, including S-phase fraction and patient outcome, were analyzed. Given the biologic relationship between HER-2 and AIB1 activation, the predictive significance of the combination of AIB1 and HER-2 expression levels was also assessed in both groups of patients.
Patients and Methods
Patients
Frozen tumor specimens from 316 breast cancer patients, all of whom had positive axillary lymph nodes at the time of initial surgery, were selected for study. Such patients have higher recurrence rates after primary treatment (i.e., initial surgery) than lymph node-negative patients, resulting in more events for better statistical power. One hundred nineteen of these patients received no adjuvant chemotherapy or tamoxifen therapy after initial surgery and 187 patients received adjuvant tamoxifen therapy. The other 10 patients received both adjuvant chemotherapy and tamoxifen therapy. The median follow-up for patients still living is 95 months. These studies were approved by the Baylor College of Medicine Institutional Review Board.
Tumor Specimens
Proteins (30 mg) from tumor tissue from each patient were extracted in 300 μL of 5% sodium dodecyl sulfate (SDS) at 90 °C for 5 minutes. Protein concentration was determined using the bicinchoninic acid (BCA) method (Pierce, Rockford, IL), according to the manufacturer‘s instructions, with typical yields of 2–5 μg/μL. Protein samples were stored at −70 °C until use.
Cell Line Standard
MCF-7 human breast cancer cell extracts were used as a standard on each gel to correct for gel-to-gel variations in band intensity. Cells were grown in 100-mm tissue culture dishes and then harvested. Proteins were then extracted in a single-step process in the culture dish. Briefly, cells were washed twice with cold phosphate-buffered saline (PBS), and proteins were extracted with 5% SDS in distilled water at 90 °C for 5 minutes. The mixture was centrifuged at 13 000g for 5 minutes, and the protein remaining in the supernatant (approximate yield = 1 μg/μL) was determined using the BCA method. Standard samples were stored at −70 °C until use.
Western Blot Assay for AIB1
AIB1 expression levels were measured by an investigator blinded to all clinical information. Briefly, 20 μg of extracted protein in sample buffer (0.05 M Tris [pH 6.8] containing 2% SDS, 2.5% β-mercaptoethanol, 10% glycerol, and 0.1% bromophenol blue as tracking dye) was placed in boiling water for 2 minutes, cooled to room temperature, and centrifuged at 13 000g for 1 minute. Protein extracted from MCF-7 cells was used as a reference standard (5 μg of protein/lane) and was included on each gel as a normalization control. Proteins were subjected to electrophoresis on 8% Tricine-Glycine polyacrylamide gels (Invitrogen, Carlsbad, CA) and transferred onto nitrocellulose membranes at 4 °C overnight at 20 mA.
Blots were then rinsed for 5 minutes with Tris-buffered saline (TBS) (100 mM Tris [pH 7.5] and 0.9% NaCl) containing 0.1% Tween-20 (TBST). After blocking with 5% nonfat dry milk in TBST, the blots were incubated overnight at 4 °C in primary antibody (1 : 1000 rabbit anti-RAC3 antiserum). This polyclonal antibody was raised in rabbits against a maltodextrin binding protein (MBP) fusion protein containing amino acid residues 582–842 of human RAC3 (i.e., AIB1). This antibody is specific for AIB1 and does not cross-react with other members of the SRC family (26). The blots were washed three times in TBST and then incubated for 1 hour at room temperature in 5% nonfat dry milk in TBST and horseradish peroxidase-labeled anti-rabbit Ig (1 : 5000) as secondary antibody (Amersham Pharmacia Biotech, Piscataway, NJ). The blots were then washed five times in TBST, after which the labeled protein was visualized on a FluorChem digital imaging system (Alpha Innotech Corp., San Leandro, CA) using an enhanced chemiluminescence detection system. Band intensities were measured densitometrically using AlphaEase FC software (Alpha Innotech Corp.). AIB1 levels in tumor samples were normalized to AIB1 levels in the MCF-7 standard control from the same immunoblot. AIB1 levels were measured once in each breast tumor extract. For most analyses, AIB1 levels were considered as a continuous variable, and no attempt was made to identify an optimal cutpoint. For some analyses, levels were arbitrarily divided into quartiles.
Other Tumor Markers
The amount of ER and PR in the tumor tissue was measured by ligand binding assays as previously described (27). Briefly, cytosols were extracted from tumor tissues that had been pulverized in liquid nitrogen. 125I-labeled estradiol and tritiated-ORG 2058 (Amersham Pharmacia Biotech) allowed for simultaneous determination of levels of both ER and PR in the standard multipoint dextran-coated charcoal assay. Tumors with an ER content of at least 3 fmol/mg protein (the limit of detection in this assay) and with a PR content of at least 10 fmol/mg protein were considered to be positive for ER and PR, respectively. These levels were based on prior studies calibrated to clinical outcome (27).
S-phase fraction was calculated by DNA flow cytometry and classified as low, intermediate, or high, as previously described (28). Briefly, DNA flow cytometry was performed on tumor extracts, and the histograms were analyzed by Modfit (Verity Software House, Topsham, ME) using single-cut debris stripping (28). Cut points were determined by calibrating S-phase fraction with clinical outcome in a group of more than 28 800 patients with breast cancer (low, <6%; intermediate, 6%–10%; high, >10%).
Immunohistochemistry was used to semiquantitatively measure p53 and Bcl-2 protein expression (29). Briefly, 5-μm sections of each paraffin-embedded specimen were stained with hematoxylin and eosin to verify adequate numbers of invasive tumor cells. Additional 5-μm sections underwent antigen retrieval in boiling citrate buffer (pH 6) in a pressure cooker for 5 minutes. For Bcl-2 immunostaining, sections were incubated for 1 hour in monoclonal antibody 124 (DAKO, Carpinteria, CA). For p53 immunostaining, sections were incubated overnight in a humidity chamber with monoclonal antibody 1801 (Novocastra Laboratories, Ltd., Newcastle upon Tyne, U.K.). A secondary biotinylated anti-mouse antibody was applied to the slides for 30 minutes at room temperature, followed by incubation with streptavidin horseradish peroxidase for 30 minutes at room temperature. The slides were then rinsed in PBS and exposed to diaminobenzidine tetrahydrochloride for 10 minutes at room temperature. Slides were then counterstained with methyl green and scored by a pathologist. A cut point of more than or equal to 10% positively stained cells was used for both Bcl-2 and p53, based on prior calibrations with clinical outcome (29).
HER-2 expression was determined by western blot analysis as described previously (30). Briefly, proteins were extracted in 5% SDS and subjected to electrophoresis on 7.5% polyacrylamide gels. An SDS extract of the T47D human breast cancer cell line was used as a reference standard. Resolved proteins were electroblotted onto a nitrocellulose membrane at 20 mA for 16 hours at 4 °C. Blots were incubated with anti-HER-2 protein antiserum overnight at 4 °C, followed by incubation with 125I-labeled donkey anti-rabbit whole antibody for 30 minutes at room temperature. The level of HER-2 protein in individual tumors was determined by densitometric scanning of the 190-kd band and expressed in terms of HER-2 units based on the T47D laboratory standard. The cut points for low (i.e., grade 0 or 1) and high (i.e., grades 2–4) HER-2 expression accurately predicted disease-free survival (DFS) in a prior study and thus were used as the cut points in this study (29,30).
Statistical Analysis
Clinical and prognostic characteristics of study patients are grouped as shown in Table 1 and are summarized by frequency distributions. Differences in frequency distributions between patients who did and did not receive adjuvant tamoxifen therapy were assessed by Fisher‘s exact test. Associations between clinical and molecular factors, which were all treated as continuous variables, were assessed by the Spearman rank correlation.
DFS was calculated from the date of diagnosis. First recurrence (local or distant) was scored as an event, and patients without recurrence were censored at the time of last follow-up or death from any cause. For graphical presentation, follow-up was truncated at 120 months. Overall survival (OS) was calculated from the date of diagnosis, with death from any cause being scored as an event. Patients who were alive at the last follow-up were censored at the last follow-up date. Survival curves were derived from Kaplan–Meier estimates (31), and the curves were compared by log-rank tests (32).
Separate analyses were performed for those patients who did and did not receive adjuvant tamoxifen therapy. The association of the level of AIB1 expression with patient outcome, adjusted for other prognostic factors, was assessed in multivariable analysis by Cox proportional hazards models (33). The assumption of proportional hazards was verified separately in each treatment group by using the method of Grambsch and Therneau (34). Explanatory variables conformed to the assumption of proportionality, except for ER (dichotomized ER-positive versus -negative) in patients who did not receive adjuvant tamoxifen therapy (P = .005). The nonproportionality resulted from a loss of prognostic effect for ER after the first 3 years of follow-up. Multivariable analyses that did or did not include an additional time-dependent variable to account for this change in the effect of ER after 3 years yielded virtually identical results for other explanatory variables, and therefore only the simpler, time-independent analyses are presented (34). All statistical tests were two-sided at the 5% level of statistical significance and were performed using SAS (version 8.0) or SPLUS (version 6.1) (SAS Institute, Cary, NC). A Wald test was used to assess the statistical significance of individual prognostic factors. Survival rates and hazard ratios are presented with their 95% confidence intervals (CIs).
Results
Characteristics of Patients and Tumor Specimens
Patient and tumor characteristics for the entire study population and for each treatment group are shown in Table 1. The majority of patients (85%) were at least 50 years old and, by definition, all patients had positive axillary lymph nodes, with 55% having 1–3 positive lymph nodes. Most of the tumors were of small or intermediate size (82%) and had intermediate or high S-phase fractions (77%). Eighty-nine percent of the patients had ER-positive tumors (reflecting the patient selection criteria), 62% of patients had PR-positive tumors, and 31% of patients had HER-2 grade 2–4 tumors. The characteristics of the treatment (i.e., tamoxifen therapy or no adjuvant therapy) groups were similar, with the exception of a slightly older age, a greater proportion of ER and/or PR positivity, and a lower proportion of p53 positivity in the patients who received tamoxifen therapy.
AIB1 Expression and Correlations With Molecular Markers and Clinical Variables
Expression of AIB1 in different tumors varied widely (Fig. 1). Normalized band intensity, using the MCF-7 reference standard, ranged from 0.26 to 5.7 densitometry units, a difference of more than 20-fold. The mean band intensity across all tumors was 1.3 (95% CI = 1.22 to 1.39), and the median was 1.15.
When we examined the correlations between various molecular markers and clinical variables in the tumor specimens, ER protein expression was positively correlated with age, PR expression, and Bcl-2 expression and inversely correlated with p53 expression, S-phase fraction, and tumor size (data not shown). AIB1 protein expression (as a continuous variable), by contrast, showed a weak inverse correlation with PR expression (correlation coefficient [r] = −0.11; P = .05) and no correlation with ER expression (r = −0.07; P = .20) (Table 2). Statistically significant but weak positive correlations were observed between AIB1 expression and S-phase fraction (r = 0.21; P = .003) and HER-2 expression (r = 0.22; P<.001). The positive correlations between AIB1 expression and factors typically associated with a more aggressive phenotype (i.e., HER-2 and S-phase fraction) suggested that AIB1 expression might correlate with relatively poor prognosis.
AIB1 Expression and Prognosis
To examine the relationship between AIB1 expression and prognosis, we analyzed tumors from the 119 patients who did not receive adjuvant therapy. The exclusion of patients who received adjuvant therapy allowed us to discriminate between the prognostic (natural progression) and predictive (response to drug) effects of AIB1 expression. Although high AIB1 expression was correlated weakly with higher S-phase fraction and HER-2, both indicators of poor prognosis, high levels of AIB1 expression were associated, instead, with better prognosis (log-rank test, P = .018); 5-year DFS was 77% (95% CI = 59% to 95%) for patients in the top quartile of AIB1 expression compared with 47% (95% CI = 35% to 59%) for patients in the lower three quartiles combined (Fig. 2, A). When AIB1 expression was considered as a continuous variable, high AIB1 expression was not statistically significantly associated with better prognosis (P = .07). AIB1 expression was also not statistically significantly associated with OS, an endpoint that can be confounded by multiple treatments given after recurrence.
Several of the other prognostic factors investigated in this patient subset that had statistically significant associations with better DFS included ER positivity (P = .008) and PR positivity (P = .017). Poorer DFS was predicted by high HER-2 expression (P = .024), high S-phase fraction (P = .013), more than three positive lymph nodes (P<.001), and large tumor size (>5 cm) (P = .004). When AIB1 expression and these six prognostic factors were included in a Cox multivariable analysis of DFS (in which the values for AIB1, ER, PR, and HER-2 expression and the number of lymph nodes were dichotomized; the values for tumor size were trichotomized; and the values for S-phase fraction were treated as continuous variables [Table 3]), only the number of lymph nodes, ER status, AIB1 expression, and HER-2 expression remained statistically significant—that is, more than three positive lymph nodes, negative ER status, low AIB1 expression, and high HER-2 expression (grade 2–4) were all associated with an increased risk of recurrence. In a similar analysis, in which AIB1 expression was treated as a continuous variable, the number of positive lymph nodes (P<.001), HER-2 expression (P = .038), ER negativity (P = .006), and low AIB1 expression (P = .043) all remained statistically significant risk factors for recurrence. AIB1 protein expression (continuous or dichotomized) was still not associated with OS, even though the number of positive lymph nodes, ER expression level, and HER-2 expression were statistically significantly associated with OS (data not shown). Thus, among patients who did not receive adjuvant tamoxifen therapy, high AIB1 expression was associated with a more indolent tumor and more favorable patient outcome than was low AIB1 expression.
AIB1 and Effect of Adjuvant Tamoxifen Therapy
To examine the effect of AIB1 expression on the benefit of adjuvant tamoxifen therapy, we analyzed tumors from the 187 patients who had received adjuvant tamoxifen therapy. AIB1 expression levels in these patients were similar to those observed in the patients who had not received adjuvant tamoxifen therapy (Table 1). AIB1 expression was not a favorable factor for DFS in the tamoxifen-treated patients compared with DFS in untreated patients. Patients in the top quartile of AIB1 expression had worse DFS than patients in the lower three quartiles combined, although the difference did not reach statistical significance. When the 10 known ER-negative patients were omitted from the analysis and AIB1 expression was considered as a continuous variable, high AIB1 expression was statistically significantly associated with poorer DFS (hazard ratio [HR] = 1.43, 95% CI = 1.03 to 1.97; P = .031) (data not shown). High AIB1 expression, when treated as a continuous variable, remained a statistically significant adverse factor in a multivariable analysis (HR = 1.45, 95% CI = 1.06 to 1.97; P = .028), along with more than three positive lymph nodes (HR = 2.73, 95% CI = 1.64 to 4.54; P<.001) (Table 3), whereas ER and PR status, HER-2 expression, and S-phase fraction were not statistically significant predictors of outcome. As was the case in patients who did not receive adjuvant therapy, AIB1 expression was not a predictor of OS in patients who had received adjuvant tamoxifen.
Thus, although high AIB1 expression was associated with better DFS for patients who had not received adjuvant therapy, high levels of AIB1 were associated with poorer DFS in patients who had received tamoxifen. A test for interaction between AIB1 expression and treatment (tamoxifen-treated patients) or not (untreated patients) was highly statistically significant (P = .004), thus confirming that the association of AIB1 expression with DFS is different in the tamoxifen-treated patients (data not shown). These data suggest that tumors expressing high levels of AIB1 protein may be tamoxifen resistant.
Interaction of AIB1 and HER-2
Because one of the consequences of HER-2 signaling is the activation of AIB1 and because some studies (23,24) have suggested that high HER-2 expression may be associated with tamoxifen resistance, we examined whether high HER-2 expression might, via activation of AIB1, further modulate the response of ER to tamoxifen and thus cause a higher level of resistance. An analysis of the interaction of HER-2 and AIB1 in patients who did not receive adjuvant therapy (Table 4) showed that when HER-2 expression was low, high AIB1 expression (top quartile) predicted better DFS than lower AIB1 expression (lower three quartiles combined) (log-rank test, P = .013); 5-year DFS was 88% (95% CI = 73% to 100%) and 53% (95% CI = 39% to 67%), respectively. Fig. 2, B, shows that the patients with high AIB1 expression and low HER-2 expression, although relatively few in number (n = 19), had statistically significantly better DFS than patients with low AIB1 expression and low HER-2 expression, high AIB1 expression and high HER-2 expression, or low AIB1 expression and high HER-2 expression as a group (log-rank test, P = .005). Thus, high HER-2 expression was an adverse prognostic factor for DFS in the untreated patients, and the level of AIB1 expression did not appear to have an additional effect on patient outcome.
Among patients receiving adjuvant tamoxifen therapy who had low HER-2 expression (Table 4), high AIB1 expression was not statistically significantly associated (P = .20) with an unfavorable outcome, perhaps because that group of patients lacked the high HER-2 expression needed to functionally activate AIB1. Among patients receiving adjuvant tamoxifen therapy who had high HER-2 expression, however, high AIB1 expression was an adverse predictive factor (P = .003). Kaplan–Meier estimates of DFS comparing patients in the high AIB1/high HER-2 group with all other patients combined are shown in Fig. 2, C. DFS in the group of patients with high AIB1 expression and high HER-2 expression was much worse (5-year DFS = 42%, 95% CI = 22% to 63%) than the other three groups of patients combined (5-year DFS = 70%, 95% CI = 62% to 77%) (log-rank test, P = .002). Interestingly, the group of patients with high HER-2 expression but low AIB1 expression had favorable DFS, despite having high HER-2 expression (5-year DFS = 77%, 95% CI = 63% to 92%). Thus, in the presence of tamoxifen, high HER-2 expression may be an indicator of poor outcome and, therefore, perhaps of tamoxifen resistance, only if high levels of AIB1 are available to mediate the adverse effect.
Discussion
To our knowledge, this is the first article comparing protein expression levels of the ER coactivator AIB1 with tumor and clinical variables in patients with primary breast cancer. Because the tumor specimens were not derived from patients randomly assigned to either a no-adjuvant-treatment group or to an adjuvant tamoxifen group and because many of the analyses are exploratory, the results presented here are not definitive with regard to their clinical implications. Nevertheless, our results confirm and extend hypotheses derived from preclinical studies that suggest that high AIB1 expression levels might reduce the antagonist activity of tamoxifen, and they provide a direct demonstration that ER coactivators can be important in the pathophysiology of disease in humans.
We found that, in patients known to have ER-positive primary breast cancer who were treated by surgery followed by adjuvant tamoxifen therapy, high levels of the ER coactivator AIB1 are associated with poor DFS in both univariate and multivariable analyses. These data support the hypothesis that the estrogen agonist activity of SERMs such as tamoxifen can be enhanced by high levels of ER coactivators, as has been observed in laboratory studies (12,25), rendering the drug less antiestrogenic in patients with high AIB1 levels. In multivariable analyses of these primarily ER-positive patients, AIB1 expression was an even more important predictor of tamoxifen responsiveness than expression of PR or HER-2, molecular markers previously shown to predict tamoxifen benefit or resistance (23,24). These results are even more striking when viewed in the context that, among patients who did not receive adjuvant therapy, higher AIB1 expression was associated with a less aggressive clinical course and better patient outcome than lower AIB1 expression. Thus, the test for interaction between AIB1 and tamoxifen treatment (or no treatment) was highly statistically significant.
Ample biologic evidence suggests a mechanism whereby ER coactivators like AIB1 might modulate the estrogen agonist or antagonist properties of tamoxifen or other SERMs to reduce their antitumor activity in patients (9,12,25). Moreover, our data suggest that AIB1 may contribute to the reduced benefit from tamoxifen that has been reported in some, although not all, studies of patients with ER-positive tumors that also express high levels of HER-2 (23,24). Signaling through the HER-2 receptor activates MAPK, which in turn phosphorylates not only the ER but also AIB1 (21). Increased agonist activity of tamoxifen-bound ER induced by AIB1 might thereby reduce the clinical benefit of adjuvant tamoxifen therapy. Our observations of a positive correlation between AIB1 and HER-2 protein levels, which has also been observed at the RNA level (19, and of worse outcome for tamoxifen-treated patients whose tumors express high levels of both AIB1 and HER-2 are, therefore, clinically important. Our data suggest that only those tumors with high levels of HER-2 expression that also express high levels of AIB1, a downstream target of this kinase signaling pathway, are relatively resistant to tamoxifen treatment. The inconsistent results in prior studies (23,24), in which only HER-2 was measured in tamoxifen-treated patients, could be due in part to the failure of these studies to include consideration of AIB1, which may also be necessary to elicit the agonist activity of tamoxifen, and in part to the lack of assay standardization for the measurement of HER-2. It is also clinically important to emphasize that, in our study, patients with tumors that had high HER-2 expression alone, without high levels of AIB1, responded to adjuvant tamoxifen treatment just as well as patients with tumors that had low HER-2 expression.
More study is required to determine the levels of HER-2 expression relative to AIB1 expression that are necessary for the tamoxifen-resistant tumor phenotype. The highly amplified levels of HER-2 found in some breast cancers, which are necessary for tumor response to HER-2-targeted therapies, may not be necessary to induce an increased estrogen agonist function of tamoxifen-bound ER. Furthermore, given the relatively high level of EGFR expression in normal breast ductal epithelium, AIB1 levels in normal and premalignant breast epithelium may have implications for the effectiveness of tamoxifen in cancer prevention. A recent report (34) suggests that AIB1 is an important modifier gene contributing to the high incidence of breast cancer in patients carrying BRCA1 mutations (35). AIB1 is, therefore, a potential diagnostic as well as therapeutic target for breast cancer prevention and treatment.
The association we observed between high levels of AIB1 and more favorable DFS in patients not receiving adjuvant therapy is more difficult to explain. Breast cancers arising in women taking estrogen replacement therapy (ERT) are known to be less aggressive and to be associated with more favorable patient outcome than breast cancers arising in women who did not take ERT (36–38). It is possible that enhanced signaling through the ER in women taking exogenous estrogen promotes and maintains a more differentiated and less biologically aggressive tumor. High AIB1 levels, by further augmenting ER agonist activity, might then promote a tumor that is not only less aggressive but also less responsive to tamoxifen therapy. The correlations between high AIB1 expression and both high S-phase fraction and high HER-2 expression observed in this study may seem inconsistent with less aggressive tumor behavior, but these correlations were weak, albeit highly statistically significant. Thus, further study of AIB1 in untreated patients is necessary, not only to confirm these observations, but also to clarify the mechanism(s) by which high AIB1 expression is associated with better DFS in patients who did not receive adjuvant therapy.
Only a few studies (13,17–19,39) have investigated the expression of ER coactivators in clinical breast cancer samples, and only one (39) measured protein rather than mRNA. That study showed that AIB1 protein is expressed at higher levels in breast tumors than in normal breast tissue (39). The AIB1 gene is amplified in a small proportion of ER-positive breast cancers, and it is overexpressed at the RNA level in 30%–60% of breast cancers compared with normal breast epithelium (13,17–19). One study (18) found a correlation between ER status and AIB1 expression. Another study (19) reported that AIB1 RNA expression was higher in tumors of high histologic grade, in tumors that were ER- and PR-negative, and in tumors with p53 mutations or high HER-2 expression. In contrast, we found no correlation between high AIB1 expression and ER expression, although we did find a positive correlation with HER-2 expression.
To our knowledge, no prior studies have correlated AIB1 protein expression with clinical outcome. One small study of 21 primary breast tumors (40) measured mRNA levels of SRC-1, an ER coactivator related to AIB1. SRC-1 expression was reduced in tumor tissues compared with normal ductal epithelium, and high levels of SRC-1 in the primary tumor correlated with response to tamoxifen when it was given later, at the time of distant metastases (39). In endometrial cells, high levels of SRC-1 were associated with increasing tamoxifen agonist activity, suggesting a mechanism for the proliferative effects of tamoxifen in that tissue (41). Clearly, further research is needed to evaluate AIB1, SRC-1, and other ER coregulators in clinical breast cancer samples.
In summary, our results suggest that high expression of AIB1 and possibly other ER coactivators can reduce the estrogen antagonist activity of tamoxifen-bound ER in breast cancer patients, so that the level of AIB1 expression in the tumor may be an important predictive marker for tamoxifen resistance in clinical breast cancer. Our data also suggest that high levels of AIB1 must be present for the tamoxifen resistance associated with high HER-2 expression to be clinically manifest. Ideally, the prognostic significance of AIB1 expression should be confirmed in patients who are randomly assigned to no systemic adjuvant therapy, and the predictive significance of AIB1 expression should be evaluated by testing the interaction between AIB1 expression and treatment in a randomized setting (42). It will also be important to determine whether levels of AIB1 and HER-2 correlate with response to endocrine therapies that work by mechanisms different from that of tamoxifen. ER coactivator levels and ligand-independent activation of ER (induced by the HER-2 pathway) may be less important for therapies such as aromatase inhibitors, which are designed to reduce the estrogen concentration (the natural ligand for ER), than for treatment with SERMs, which are receptor ligands that have mixed agonist and antagonist properties on the ER. Results from a recent clinical trial showing a much higher response for aromatase inhibitors compared with tamoxifen in ER-positive tumors that express high levels of HER-2 support this possibility (43). Although ER and PR status are clinically useful tumor markers, many patients with ER-positive tumors still fail to benefit from hormone therapies. Therefore, other biomarkers are needed to identify these patients. This study suggests that AIB1 is one such potential marker that deserves additional investigation as both a diagnostic and a therapeutic target.
Patient and tumor characteristics*
| Variable | All patients, No. (%) | Untreated patients, No. (%) | Tamoxifen-treated patients, No. (%) | P value† |
|---|---|---|---|---|
| *Ten patients treated with adjuvant chemotherapy plus tamoxifen were included in the “All patients” category and were used for initial correlations, but they are not included in the “Untreated” or “Tamoxifen-treated” categories. The number of patients with missing data is shown, but they are not included in the calculation of percentages or in Fisher‘s exact test. ER = estrogen receptor; PR = progesterone receptor; IHC = immunohistochemistry. | ||||
| †P values were derived from Fisher‘s exact test. | ||||
| ‡Corrected densitometry units from western blots were normalized to the MCF-7 reference standards. | ||||
| Age, y | ||||
| ≥50 | 269 (85) | 95 (80) | 168 (90) | |
| <50 | 47 (15) | 24 (20) | 19 (10) | .018 |
| Lymph nodes | ||||
| 1–3 | 172 (55) | 64 (54) | 104 (56) | |
| >3 | 143 (45) | 54 (46) | 83 (44) | .81 |
| Missing | 1 | 1 | 0 | |
| Tumor size, cm | ||||
| Small (<2) | 78 (25) | 23 (20) | 51 (27) | |
| Intermediate (2–5) | 180 (57) | 69 (58) | 107 (57) | |
| Large (>5) | 57 (18) | 26 (22) | 29 (16) | .17 |
| Missing | 1 | 1 | 0 | |
| S-phase fraction, % | ||||
| Low (<6) | 72 (23) | 20 (17) | 49 (27) | |
| Intermediate (6–10) | 101 (33) | 41 (35) | 59 (32) | |
| High (>10) | 137 (44) | 57 (48) | 75 (41)) | .13 |
| Missing | 6 | 1 | 4 | |
| ER | ||||
| Positive (≥3 fmol/mg) | 281 (89) | 96 (81) | 177 (95) | |
| Negative (<3 fmol/mg) | 35 (11) | 23 (19) | 10 (5) | <.001 |
| PR | ||||
| Positive (≥10 fmol/mg) | 187 (62) | 58 (53) | 122 (66) | |
| Negative (<10 fmol/mg) | 116 (38) | 52 (47) | 62 (34) | .026 |
| Missing | 13 | 9 | 3 | |
| p53 IHC score | ||||
| 0–4 | 256 (82) | 88 (76) | 160 (86) | |
| 5–8 | 55 (18) | 28 (24) | 26 (14) | .030 |
| Missing | 5 | 3 | 1 | |
| HER-2 grade | ||||
| 0–1 | 218 (69) | 84 (71) | 127 (68) | |
| 2–4 | 97 (31) | 35 (29) | 60 (32) | .70 |
| Missing | 1 | 0 | 0 | |
| Bcl-2 IHC score | ||||
| 0–4 | 125 (41) | 50 (44) | 72 (40) | |
| 5–8 | 177 (59) | 63 (56) | 108 (60) | .54 |
| Missing | 14 | 6 | 7 | |
| AIB1 expression, units | ||||
| 1st quartile | 84 ≤ .78 | 30 ≤ 0.79‡ | 48 ≤ 0.76‡ | |
| 2nd quartile | 85 > .78–1.15 | 30 > 0.79–1.17 | 46 > 0.76–1.11 | |
| 3rd quartile | 79 > 1.15–1.61 | 30 > 1.17–1.67 | 47 > 1.11–1.55 | |
| 4th quartile | 68 > 1.61 | 29 > 1.67 | 46 > 1.55 | |
Spearman rank correlations of AIB1 expression with molecular markers and clinical variables*
| Variable | N | AIB1 correlation coefficient† | P value‡ |
|---|---|---|---|
| *ER = estrogen receptor; PR = progesterone receptor; N = number of patients for whom data were available. | |||
| †All variables are continuous. | |||
| ‡P values were derived from a two-sided one-sample t test. | |||
| ER | 316 | −0.07 | .20 |
| PR | 303 | −0.11 | .05 |
| p53 | 311 | 0.09 | .10 |
| HER-2 | 315 | 0.22 | <.001 |
| Age | 316 | 0.008 | .88 |
| Tumor size | 315 | 0.09 | .09 |
| S-phase fraction | 310 | 0.21 | .003 |
| Bcl-2 | 302 | −0.08 | .15 |
| Lymph nodes | 315 | 0.07 | .22 |
Cox multivariable analyses of disease-free survival in patients who received no adjuvant therapy and patients who received adjuvant tamoxifen therapy*
| No adjuvant therapy (N = 108; 47 recurrences)† | Adjuvant tamoxifen therapy (N = 180; 64 recurrences)† | |||
|---|---|---|---|---|
| Variable | HR (95% CI) | P value‡ | HR (95% CI) | P value‡ |
| *Multivariable analysis was performed using stepwise Cox proportional hazards regression with forward selection (see “Patients and Methods” section). Candidate exploratory variables included lymph nodes, tumor size, estrogen receptor (ER), progesterone receptor, HER-2, and AIB1. HR = hazard ratio; CI = confidence interval; NS = variable not statistically significant in model; — = variable was not included in the statistical model. | ||||
| †Patients with missing data could not be included in the analysis. | ||||
| ‡P values were derived from a two-sided Wald test. | ||||
| §AIB1 was treated as a continuous variable in adjuvant tamoxifen therapy patients. | ||||
| More than three positive lymph nodes | 4.04 (2.16 to 7.58) | <.001 | 2.73 (1.64 to 4.54) | <.001 |
| ER negative | 2.84 (1.36 to 5.93) | .006 | — | NS |
| AIB1 (top quartile) | 0.32 (0.13 to 0.75) | .009 | 1.45 (1.06 to 1.97)§ | .028 |
| HER-2 (grade 2–4) | 1.90 (1.02 to 3.51) | .039 | — | NS |
Five-year disease-free survival (DFS) by AIB1 and HER-2 status in patients stratified by treatment group*
| No adjuvant therapy (N = 119) | Adjuvant tamoxifen therapy (N = 187) | |||||
|---|---|---|---|---|---|---|
| Variable | No. of patients | 5-year DFS (95% CI) | P value† | No. of patients | 5-year DFS (95% CI) | P value† |
| *CI = confidence interval. | ||||||
| †P value was derived from two-sided log-rank test. | ||||||
| High HER-2 (grade 2–4) | ||||||
| High AIB1 (top quartile) | 10 | 36% (0% to 88%) | .40 | 25 | 42% (22% to 63%) | .003 |
| Low AIB1 (lower three quartiles) | 25 | 33% (13% to 54%) | 35 | 77% (63% to 92%) | ||
| Low HER-2 (grade 0–1) | ||||||
| High AIB1 (top quartile) | 19 | 88% (73% to 100%) | .013 | 21 | 83% (64% to 100%) | .20 |
| Low AIB1 (lower three quartiles) | 65 | 53% (39% to 67%) | 106 | 64% (54% to 74%) | ||
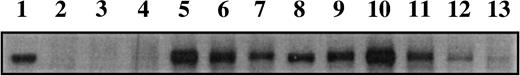
Example of a western blot showing AIB1 expression from extracts of 12 representative tumors. Lane 1 is the standard (5 μg of MCF-7 extract protein) that was used to normalize AIB1 levels between blots. Protein (20 mg) was added to each lane.
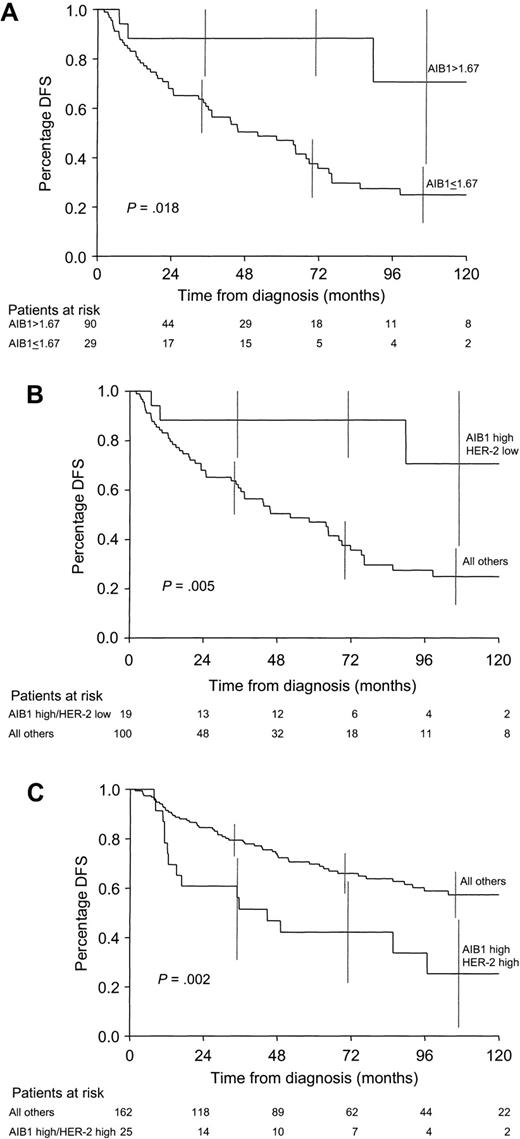
Kaplan–Meier estimates of disease-free survival (DFS). A) DFS according to AIB1 expression for patients who did not receive adjuvant therapy (n = 119). Patients with high AIB1 expression (top quartile: AIB1>1.67 densitometric units) were compared with patients with lower AIB1 expression (≤1.67 densitometric units). B) DFS curves for patients who did not receive adjuvant therapy (n = 119). Patients with high AIB1 expression (top quartile) and low HER-2 expression were compared with patients with high expression of both AIB1 and HER-2, low expression of both AIB1 and HER-2, or low AIB1 expression and high HER-2 expression. C) DFS for patients who received adjuvant tamoxifen therapy (n = 187). Patients with high AIB1 expression (top quartile) and high HER-2 expression (grades 2–4) were compared with patients with high expression of both AIB1 and HER-2, low expression of both AIB1 and HER-2, or low AIB1 expression and high HER-2 expression. All P values refer to two-sided log-rank tests. Numbers below each graph indicate the number of patients remaining at risk in each group. Vertical lines are the 95% confidence intervals at selected time points.
Supported in part by Public Health Service grants P01CA30195 and P50CA50183 (Breast Cancer Specialized Projects of Oncology Research Excellence [SPORE] grant) from the National Cancer Institute, National Institutes of Health, Department of Health and Human Services.
References
Ali S, Metzger D, Bornert JM, Chambon P. Modulation of transcriptional activation by ligand-dependent phosphorylation of the human oestrogen receptor A/B region.
Arnold SF, Obourn JD, Jaffe H, Notides AC. Serine 167 is the major estradiol-induced phosphorylation site on the human estrogen receptor.
Le Goff P, Montano MM, Schodin DJ, Katzenellenbogen BS. Phosphorylation of the human estrogen receptor. Identification of hormone-regulated sites and examination of their influence on transcriptional activity.
Kato S, Endoh H, Masuhiro Y, Kitamoto T, Uchiyama S, Sasaki H, et al. Activation of the estrogen receptor through phosphorylation by mitogen-activated protein kinase.
Bunone G, Briand PA, Miksicek RJ, Picard D. Activation of the unliganded estrogen receptor by EGF involves the MAP kinase pathway and direct phosphorylation.
Pietras RJ, Arboleda J, Reese DM, Wongvipat N, Pegram MD, Ramos L, et al. HER-2 tyrosine kinase pathway targets estrogen receptor and promotes hormone-independent growth in human breast cancer cells.
McKenna NJ, Lanz RB, O‘Malley BW. Nuclear receptor coregulators: cellular and molecular biology.
Jackson TA, Richer JK, Bain DL, Takimoto GS, Tung L, Horwitz KB. The partial agonist activity of antagonist-occupied steroid receptors is controlled by a novel hinge domain-binding coactivator L7/SPA and the corepressors N-CoR or SMRT.
McInerney EM, Tsai MJ, O‘Malley BW, Katzenellenbogen BS. Analysis of estrogen receptor transcriptional enhancement by a nuclear hormone receptor coactivator.
Lavinsky RM, Jepsen K, Heinzel T, Torchia J, Mullen TM, Schiff R, et al. Diverse signaling pathways modulate nuclear receptor recruitment of N-CoR and SMRT complexes.
Shiau AK, Barstad D, Loria PM, Cheng L, Kushner PJ, Agard DA, et al. The structural basis of estrogen receptor/coactivator recognition and the antagonism of this interaction by tamoxifen.
Smith CL, Nawaz Z, O‘Malley BW. Coactivator and corepressor regulation of the agonist/antagonist activity of the mixed antiestrogen, 4-hydroxytamoxifen.
Anzick SL, Kononen J, Walker RL, Azorsa DO, Tanner MM, Guan XY, et al. AIB1, a steroid receptor coactivator amplified in breast and ovarian cancer.
Torchia J, Rose DW, Inostroza J, Kamei Y, Westin S, Glass CK, et al. The transcriptional co-activator p/CIP binds CBP and mediates nuclear-receptor function.
Li H, Gomes PJ, Chen JD. RAC3, a steroid/nuclear receptor-associated coactivator that is related to SRC-1 and TIF2.
Chen H, Lin RJ, Schiltz RL, Chakravarti D, Nash A, Nagy L, et al. Nuclear receptor coactivator ACTR is a novel histone acetyltransferase and forms a multimeric activation complex with P/CAF and CBP/p300.
Murphy LC, Simon SL, Parkes A, Leygue E, Dotzlaw H, Snell L, et al. Altered expression of estrogen receptor coregulators during human breast tumorigenesis.
Bautista S, Valles H, Walker RL, Anzick S, Zeillinger R, Meltzer P, et al. In breast cancer, amplification of the steroid receptor coactivator gene AIB1 is correlated with estrogen and progesterone receptor positivity.
Bouras T, Southey MC, Venter DJ. Overexpression of the steroid receptor coactivator AIB1 in breast cancer correlates with the absence of estrogen and progesterone receptors and positivity for p53 and HER2/neu.
List HJ, Lauritsen KJ, Reiter R, Powers C, Wellstein A, Riegel AT. Ribozyme targeting demonstrates that the nuclear receptor coactivator AIB1 is a rate-limiting factor for estrogen-dependent growth of human MCF-7 breast cancer cells.
Font de Mora J, Brown M. AIB1 is a conduit for kinase-mediated growth factor signaling to the estrogen receptor.
Benz CC, Scott GK, Sarup JC, Johnson RM, Tripathy D, Coronado E, et al. Estrogen-dependent, tamoxifen-resistant tumorigenic growth of MCF-7 cells transfected with HER2/neu.
Mass R. The role of HER-2 expression in predicting response to therapy in breast cancer.
Ciocca DR, Elledge R. Molecular markers for predicting response to tamoxifen in breast cancer patients.
Takimoto GS, Graham JD, Jackson TA, Tung L, Powell RL, Horwitz LD, et al. Tamoxifen resistant breast cancer: coregulators determine the direction of transcription by antagonist-occupied steroid receptors.
Wu RC, Qin J, Hashimoto Y, Wong J, Xu J, Tsai SY, et al. Regulation of SRC-3 (pCIP/ACTR/AIB-1/RAC-3/TRAM-1) coactivator activity by I kappa B kinase.
Harvey JM, Clark GM, Osborne CK, Allred DC. Estrogen receptor status by immunohistochemistry is superior to the ligand-binding assay for predicting response to adjuvant endocrine therapy in breast cancer.
Wenger CR, Clark GM. S-phase fraction and breast cancer—a decade of experience.
Elledge RM, Green S, Howes L, Clark GM, Berardo M, Allred DC, et al. bcl-2, p53, and response to tamoxifen in estrogen receptor-positive metastatic breast cancer: a Southwest Oncology Group study.
Tandon AK, Clark GM, Chamness GC, Ullrich A, McGuire WL. HER-2/neu oncogene protein and prognosis in breast cancer.
Kaplan E, Meier P. Non-parametric estimation for incomplete observation.
Peto R, Peto J. Asymptotically efficient rank invariant test procedures (with discussion).
Grambsch P, Therneau T. Proportional hazards tests and diagnostics based on weighted residuals.
Rebbeck TR, Wang Y, Kantoff PW, Krithivas K, Neuhausen SL, Godwin AK, et al. Modification of BRCA1- and BRCA2-associated breast cancer risk by AIB1 genotype and reproductive history.
Bergkvist L, Adami HO, Persson I, Bergstrom R, Krusemo UB. Prognosis after breast cancer diagnosis in women exposed to estrogen and estrogen-progestogen replacement therapy.
Jernstrom H, Frenander J, Ferno M, Olsson H. Hormone replacement therapy before breast cancer diagnosis significantly reduces the overall death rate compared with never-use among 984 breast cancer patients.
Gapstur SM, Morrow M, Sellers TA. Hormone replacement therapy and risk of breast cancer with a favorable histology: results of the Iowa Women‘s Health Study.
List HJ, Reiter R, Singh B, Wellstein A, Riegel AT. Expression of the nuclear coactivator AIB1 in normal and malignant breast tissue.
Berns EM, van Staveren IL, Klijn JG, Foekens JA. Predictive value of SRC-1 for tamoxifen response of recurrent breast cancer.
Shang Y, Brown M. Molecular determinants for the tissue specificity of SERMs.
Clark GM. Interpreting and integrating risk factors for patients with primary breast cancer.
Ellis MJ, Coop A, Singh B, Mauriac L, Llombert-Cussac A, Janicke F, et al. Letrozole is more effective neoadjuvant endocrine therapy than tamoxifen for ErbB-1- and/or ErbB-2-positive, estrogen receptor-positive primary breast cancer: evidence from a phase III randomized trial.

