


Abstract
The incidence of nonmelanoma skin cancer (NMSC) is equivalent to that of all other cancers combined. Previously, we mapped the 12-O-tetradecanoylphorbol-13-acetate (TPA) skin tumor promotion susceptibility locus, Psl1, to distal chromosome 9 in crosses of sensitive DBA/2 mice with relatively resistant C57BL/6 mice. Here, we used the mouse two-stage skin carcinogenesis model to identify the gene(s) responsible for the effects of Psl1.
Interval-specific congenic mouse strains (n ≥ 59 mice per strain) were used to more precisely map the Psl1 locus. Having identified glutathione S-transferase α4 (Gsta4) as a candidate tumor promotion susceptibility gene that mapped within the delimited region, we analyzed Gsta4-deficient mice (n = 62) for susceptibility to skin tumor promotion by TPA. We used quantitative polymerase chain reaction, western blotting, and immunohistochemistry to verify induction of Gsta4 in mouse epidermis following TPA treatment and biochemical assays to associate Gsta4 activity with tumor promotion susceptibility. In addition, single-nucleotide polymorphisms (SNPs) in GSTA4 were analyzed in a case–control study of 414 NMSC patients and 450 control subjects to examine their association with human NMSC. Statistical analyses of tumor studies in mice were one-sided, whereas all other statistical analyses were two-sided.
Analyses of congenic mice indicated that at least two loci, Psl1.1 and Psl1.2, map to distal chromosome 9 and confer susceptibility to skin tumor promotion by TPA. Gsta4 maps to Psl1.2 and was highly induced (mRNA and protein) in the epidermis of resistant C57BL/6 mice compared with that of sensitive DBA/2 mice following treatment with TPA. Gsta4 activity levels were also higher in the epidermis of C57BL/6 mice following treatment with TPA. Gsta4-deficient mice (C57BL/6.Gsta4-/- mice) were more sensitive to TPA skin tumor promotion (0.8 tumors per mouse vs 0.4 tumors per mouse in wild-type controls; difference = 0.4 tumors per mouse; 95% confidence interval = 0.1 to 0.7, P = .007). Furthermore, inheritance of polymorphisms in GSTA4 was associated with risk of human NMSC. Three SNPs were found to be independent predictors of NMSC risk. Two of these were associated with increased risk of NMSC (odds ratios [ORs] = 1.60 to 3.42), while the third was associated with decreased risk of NMSC (OR = 0.63). In addition, a fourth SNP was associated with decreased risk of basal cell carcinoma only (OR = 0.44).
Gsta4/GSTA4 is a novel susceptibility gene for NMSC that affects risk in both mice and humans.
These authors previously mapped a promotion susceptibility locus, Psl1, to mouse chromosome 9. It conferred sensitivity to the tumor promoter 12-O-tetradecanoylphorbol-13-acetate (TPA) in a mouse model of nonmelanoma skin carcinogenesis. Here, they asked which gene(s) are responsible for TPA-sensitivity at this locus.
Using congenic mouse strains and TPA-sensitivity tests, Psl1 could be more finely mapped to two adjacent loci, Psl1.1 and Psl1.2, that each contribute to TPA promotion sensitivity. Experiments using various mouse strains were performed to determine whether the glutathione S-transferase gene, Gsta4, which maps to the latter locus, confers TPA resistance in C57BL/6 mice. In addition, nonmelanoma skin cancer (NMSC) patients were genotyped to determine whether the human homolog, GSTA4, conferred risk.
Gsta4 was highly induced by TPA in the epidermis of resistant C57BL/6 mice but not in sensitive DBA/2 mice. Gsta4-deficient mice were more sensitive to TPA-induced skin tumors than Gsta4-expressing mice. In humans, four single-nucleotide polymorphisms in GSTA4 were associated with risk of either basal cell or squamous cell carcinomas.
The Gsta4/GSTA4 gene affects risk of nonmelanoma skin cancer in mice and humans.
It is possible, but unlikely, that a very closely linked gene could be responsible for the apparent effect of Gsta4 in both species. The mechanism whereby Gsta4 modifies skin tumor development needs to be further explored, and larger population-based studies will be needed to verify the association of GSTA4 with NMSC in humans.
From the Editors
Nonmelanoma skin cancer (NMSC) is the most common type of malignancy in humans; approximately one million new patients are diagnosed each year (1). In 2006, the incidence of NMSC (including squamous cell carcinomas and basal cell carcinomas) approximately equaled that of all other human cancers combined (reviewed in 2), and the morbidity and economic burden associated with these malignancies continues to escalate (3–6). Several studies have linked polymorphisms in DNA repair and biotransformation genes to risk of NMSC; however, a substantial fraction of the genetic variation in susceptibility to these cancers remains unexplained (7–9).
Genome-wide association studies and pathway analyses that are designed to identify disease susceptibility genes in humans typically detect only common alleles with relatively large effects (10). These studies often result in the identification of quantitative trait loci rather than candidate genes (10,11), so the mechanistic impact of the genetic variation is rarely obvious. Furthermore, human studies are complicated by such factors as genetic heterogeneity, the multiplicity of genes involved, epistatic interactions, and variation in environmental exposures (reviewed in 12,13). For these reasons, complementary gene mapping and validation approaches including cross-species comparisons using animal models are needed to identify genes that modify disease phenotypes such as skin cancer susceptibility (13–15). The utility of this approach is illustrated by successes in translating quantitative trait loci in mice to identification of human disease susceptibility loci (13–15).
Genetic differences among various mouse stocks and strains in susceptibility to two-stage skin carcinogenesis have been known for many years, and the major genetic contribution to susceptibility appears to lie in the response to tumor promotion (16–21). We previously reported the mapping of a skin tumor promotion susceptibility locus, Psl1, to mouse chromosome 9 in genetic crosses of resistant C57BL/6 mice with sensitive DBA/2 mice (22–24). In this report, we used interval-specific congenic mouse strains to demonstrate that at least two genes that map within Psl1, designated as Psl1.1 and Psl1.2, modify the response to 12-O-tetradecanoylphorbol-13-acetate (TPA) skin tumor promotion. Next, we gathered strong evidence to show that glutathione S-transferase α4 (Gsta4) is a novel skin tumor promotion susceptibility gene that underlies the effects of Psl1.2. Quantitative polymerase chain reaction, western blotting, and immunohistochemistry were used to show that Gsta4 mRNA and protein levels were differentially induced in the epidermis of C57BL/6 compared with DBA/2 mice in response to TPA treatment. Furthermore, Gsta4 enzymatic activity was also induced in epidermal extracts from TPA-treated C57BL/6 mice. Gsta4-defiicent mice were used to confirm that Gsta4 is a TPA skin tumor promotion susceptibility gene. To determine the role of glutathione S-transferase α4 (GSTA4) in human skin cancer, we conducted a tag single-nucleotide polymorphism (SNP)-based NMSC case–control study.
Materials and Methods
Mice
C57BL/6, DBA/2, and B×D22 recombinant inbred mice were obtained from the Jackson Laboratory (Bar Harbor, ME). All crosses were generated in the vivarium at the University of Texas M.D. Anderson Cancer Center, Science Park—Research Division. To generate the congenic strains, C57BL/6 mice were crossed with B×D22 recombinant inbred mice, which are sensitive to skin tumor promotion by TPA and homozygous for the DBA/2 allele of Psl1 (23). Marker-assisted selection was used to generate the congenic strains and over 400 microsatellite markers mapping outside the approximately 40 cM region of interest on chromosome 9, which mapped between D9Mit316 and D9Mit19, were homozygous for the C57BL/6 allele after five backcross generations. Mice heterozygous for the approximately 40 cM region of interest were brother–sister mated, and the progeny were genotyped for distal chromosome 9 markers. Progeny homozygous for the DBA/2 allele of markers mapping to this region were brother–sister mated and designated as C57BL/6.Psl1Adba. To generate subcongenic strains, C57BL/6.Psl1Adba mice were crossed to C57BL/6 mice, and F1 progeny were backcrossed to C57BL/6 mice. Recombinants were identified and bred to homozygosity. Polymerase chain reaction (PCR) analysis of polymorphic microsatellite markers was used to genotype the congenic strains as previously described (22). Gsta4-deficient mice have been previously described (25) and were backcrossed for at least 10 generations to C57BL/6J (referred to as C57BL/6.Gsta4-/- mice). Gsta4-deficient mice were genotyped as previously described (26). Mice were maintained in a specific pathogen-free environment in accordance with institutional guidelines and were housed five per plastic cage in an air-conditioned room at 24°C ± 2°C, had free access to food and water, and were exposed to a 12-hour light and dark cycle.
Reagents
We purchased TPA from LC Laboratories (Woburn, MA); 4-hydroxy-2(E)-nonenal (4-HNE) was obtained from Cayman Chemical (Ann Arbor, MI); 7,12-dimethylbenz(a)anthracene (DMBA) and N-methyl-N′-nitro-N-nitrosoguanidine (MNNG) were obtained from Sigma-Aldrich (St Louis, MO).
Tumor Experiments
Female C57BL/6, C57BL/6.Gsta4-/-, or C57BL/6.Psl1dba mice 7–9 weeks of age were used. A standard area on the dorsal skin extending from the base of the tail to the base of the head was shaved on each mouse. Forty-eight hours later, only those mice in the resting phase of the hair growth cycle were treated with the tumor-initiating agent (MNNG or DMBA). The skin of C57BL/6 mice in the anagen phase of the hair cycle appears thickened and dark compared with the skin in the resting phase due to extended hair follicle length. In addition, mice still in the anagen phase may display partial hair regrowth after shaving; these mice were excluded from the tumor study. All chemicals (in 0.2 mL of acetone) were applied topically to the shaved area. For the experiments using subcongenic strains, approximately 30 female mice of each subcongenic strain or 30 female C57BL/6 mice were initiated with 2.5 μmol MNNG and 2 weeks later were treated with 13.6 nmol of the tumor promoter TPA twice weekly until the tumor response reached a plateau. No tumors were detected in mice initiated with MNNG and treated twice weekly with vehicle (acetone) alone. This experiment was completed in duplicate with similar results using a total of at least 59 mice per strain. For experiments using C57BL/6.Gsta4−/− mice, groups of at least 24 age-matched female C57BL/6.Gsta4−/− mice and female wild-type control mice were randomly assigned to groups and treated with the initiating agent (100 nmol DMBA) or with vehicle only (uninitiated control mice). Two weeks later, mice were treated with 3.4 nmol TPA twice weekly for 38 weeks. This experiment was performed in duplicate with similar results; a total of at least 53 mice per strain were tested. Incidence of skin papillomas was observed and recorded weekly, and promotion was conducted for up to 40 weeks. Tumors were first scored whenever they emerged above the skin. The diameter of emerging tumors was approximately 0.5–1.0 mm. Tumor multiplicity was calculated as the cumulative number of papillomas observed divided by the number of mice at risk when the first tumor was observed. Tumor incidence was calculated as the total number of mice with tumors divided by the number of mice at risk when the first tumor was observed.
Short-term Topical Treatment With TPA
For analysis of Gsta4 expression, glutathione S-transferases (GST) activity, and glutathione-conjugated 4-HNE levels in mouse epidermis or whole skin, epidermal scrapings and skin samples were harvested after short-term topical treatment with TPA or vehicle alone. The dorsal skin of 7- to 9-week-old female mice was shaved 48 hours before treatment. The mice (≥3 mice per group) received either single or multiple (twice weekly for 2 weeks) topical applications of TPA (3.4 or 6.8 nmol) in 0.2 mL acetone.
RNA Isolation and Quantitative PCR
Following treatment with TPA or acetone, mice were killed by cervical dislocation and the treated skin was excised. Total RNA was extracted from the epidermis and assayed for Gsta4 mRNA transcript levels using quantitative PCR technology as previously described (27) using forward and reverse primers (5′-CAACCCGGAAGTCAGAGGAA-3′ and 5′-AGCACGCTGCACTAGAACTTCA-3′, respectively). Expression levels were normalized to Hras1 mRNA transcript levels using forward and reverse primers (5′-TTAGACACAGCAGGTCAAGAAGAGT-3′ and 5′-TTGATGGCAAATACACAGAGGAA-3′, respectively).
Generation of Anti-Gsta4 Antibody
To examine Gsta4 expression in epidermal lysates and formalin-fixed skin sections, a rabbit polyclonal antibody was generated by Bethyl Laboratories (Montgomery, TX) against a peptide corresponding to mouse Gsta4 amino acid residues 209–222 (CDGPYVEVVRTVLKF) using standard procedures. For western blot analyses, the antibody was used at a 1: 7500 dilution in 5% bovine serum albumin in TBST (20 mmol/L Tris–HCl, 136 mmol/L NaCl, 0.1% Tween 20 [pH 7.6]). For immunohistochemical analyses, the antibody was applied at a 1:5000 dilution.
Preparation of Epidermal Lysates for Western Blot Analyses
Whole-cell extracts were prepared for western blot analyses as follows. At various time points (4, 10, 18, 24, or 48 hours) after topical treatment with TPA (as indicated), mice were killed, and dorsal skin was excised. The skin was placed on a plate of glass over ice, and the epidermis was scraped with a razor blade into radioimmunoprecipitation assay buffer (50 mmol/L Tris-HCl [pH 7.4], 150 mmol/L NaCl, 1 mmol/L EDTA, 1% Triton X-100, protease inhibitor cocktail [P8340; Sigma-Aldrich], phosphatase inhibitor cocktails 1 and 2 [P2850 and P5726; Sigma-Aldrich]). The cell lysates were homogenized through an 18-gauge needle and then centrifuged at 14 000g for 15 minutes at 4°C.
Fifteen percent sodium dodecyl sulfate–polyacrylamide gels were used to resolve equal amounts (approximately 50 μg) of whole-cell extract, and separated proteins were electrophoretically transferred onto nitrocellulose membranes (Bio-Rad Laboratories, Hercules, CA). Membranes were blocked with 5% nonfat milk in TBST (20 mmol/L Tris–HCl, 136 mmol/L NaCl, 0.1% Tween 20 [pH 7.6]) overnight at 4°C followed by a 1-hour incubation in the presence of a rabbit polyclonal antibody to Gsta4 peptide 209–222 (Bethyl Laboratories) at a dilution of 1:5000 and a mouse monoclonal antibody to β-actin (A5316; Sigma-Aldrich) at a dilution of 1:10 000) in 5% bovine serum albumin in TBST at room temperature. Following incubation, the membranes were washed three times for 10 minutes with TBST before incubation with an appropriate horseradish peroxidase–conjugated secondary antibody. To remove unbound secondary antibody, the membranes were washed four times for 15 minutes with TBST before the protein bands were visualized using chemiluminescence detection (Pierce, Rockford, IL).
Immunohistochemical Analysis of Gsta4 Expression
Expression of Gsta4 in mouse skin was examined using immunohistochemical methods as follows. At 24 or 48 hours following the last of four topical treatments with TPA (delivered twice weekly for 2 weeks), C57BL/6, DBA/2 or C57BL/6.Gsta4−/− mice (n = 3–4 mice per group) were killed, and the dorsal skin was removed. The skin samples were formalin fixed and paraffin embedded. Subsequently, the tissues were deparaffinized, hydrated, and probed for Gsta4 expression using standard procedures. Briefly, endogenous peroxidase activity was blocked with 3% hydrogen peroxide for 10 minutes. Sections were microwaved for 15 minutes in the presence of 10 mM citrate buffer (pH 6.0). After cooling for 20 minutes, nonspecific binding was blocked by 10-minute incubation in Background Sniper blocking reagent (Biocare Medical, Concord, CA). The sections were then stained with anti-Gsta4 antibody (1:5000), followed by a secondary Envision plus anti-rabbit antibody with horseradish peroxidase–labeled polymer (Dako, Carpinteria, CA). Peroxidase reaction was assayed using diaminobenzidine (Dako) as the chromogen.
Epidermal GST Purification and Detection of Activity Toward 4-HNE
To determine the effect of TPA treatment or Gsta4 deficiency on GST-mediated conjugation activity toward 4-HNE in the epidermis, GSTs were purified from pooled epidermal whole-cell lysates harvested from at least six mice per group using a previously described method (28). The purified GST preparation was assessed spectrophotometrically for conjugation activity toward 4-HNE, as previously described (29). Increased or decreased 4-HNE conjugation activity in these GST preparations serves as an indication of the level of active Gsta4 in the epidermis. Reactions contained purified GSTs, 0.5 mM glutathione (GSH) and 0.1 mM 4-HNE incubated at 30°C, and reaction progress was monitored at 224 nm.
Sample Preparation for Detection of Glutathione-Conjugated 4-HNE in Epidermal Lysates
Twenty-four hours after the final TPA treatment, mice were killed and the dorsal skin was removed and placed on a chilled glass plate. The epidermis of each mouse was harvested by scraping and then snap frozen in liquid nitrogen. To each thawed epidermal scraping, we added 20 ng (10 μL of 2 ng/μL, 1:1 methanol to water solution) of an internal standard (d11-GS-4HNE [kindly provided by Dr Matthew Picklo]) as a sample preparation control. Five minutes later, the sample was homogenized by cell disruptor (Bronson Sonifier 250, with 25% duty cycle, output control at 3.0, and 20 pulses per sample) in 90 μL per sample of a solution of 20% methanol in 0.1% acetic acid. The homogenate was centrifuged at 14 000g for 2 minutes, and the protein concentration was determined using Nanodrop Technology. To 90 μL of supernatant, we added 9 μL of a solution of 50% trichloroacetic acid, 5 mM ethylenediamine tetraacetic acid. The sample was vortexed for 5 seconds and then centrifuged at 14 000g for 2 minutes. The final supernatant was then transferred into an autosampler vial insert (Fisher Scientific, Pittsburgh, PA), and 70 μL was injected for high-performance liquid chromatography.
Liquid Chromatography–Mass Spectrometry for Detection of Glutathione-Conjugated 4-HNE
A 4000 Q TRAP mass spectrometer (Applied Biosystems, Foster City, CA) coupled with an online high-performance liquid chromatography system (Shimadzu, Columbia, MD) was used to detect glutathione-conjugated 4-HNE in the epidermal lysates. For separation, 70 μL of the “final supernatant” above was injected into a Shimadzu Prominence ultrafast liquid chromatography system equipped with a Restek C18 (4.6 × 50 mm, 5 μm, 110 Å) column. Both d11-GS-4HNE and GS-4HNE were eluted with mobile phase A (water with 0.1% formic acid) and B (acetonitrile with 0.1% formic acid) using a linear gradient (1 minute 20% Phase B, 1 minute 20% to 60% Phase B, 1 minute 60% Phase B, 1 minute 60% to 95% Phase B), and the flow rate was set at 1 mL/minute. The supernatant was eluted from the column into the Turbo V electrospray ion source of 4000 Q TRAP. The parameters of the source and various gases were set as follows: the ion spray voltage was 4500 V; heated nebulizer temperature was set at 700°C; collisionally activated dissociation was set at medium; curtain gas, ion source gas 1, and ion source gas 2 were all set at 50; the declustering potential, entrance potential, and collision cell exit potential were at 50, 10, and 10, respectively. The multiple reaction monitoring scan experiment with low resolution for Q1 and unit resolution for Q3 was used to quantify d11-GS-4HNE and GS-4HNE. The multiple reaction monitoring transitions were set as follows: for d11-GS-4HNE, Q1 = 475.9, Q3 = 308.5, collision energy (CE) = 20; for GS-4HNE: Q1 = 464.8, Q3 = 308.2 (CE = 20), also 179.3 (CE = 30). The limit of quantification for either d11-GS-4HNE or GS-4HNE was 2 pg.
Case–Control Study
A total of 414 nonmelanoma skin cancer patients (213 with basal cell carcinomas and 201 with squamous cell carcinomas) and 450 cancer-free control subjects were included in this case–control analysis. The methodology has already been described (9). Briefly, case patients were MD Anderson Cancer Center patients registered between July 1996 and June 2001 with a histologically confirmed diagnosis of NMSC. Healthy control subjects, who were unrelated to the case patients and did not have a history of cancer (including NMSC), were recruited among friends, family members, and hospital visitors of other nonskin cancer patients during the same period of time that the case patients were recruited. Informed consent was obtained before the collection of epidemiological data. A single blood sample was collected in accordance with a protocol approved by the MD Anderson Cancer Center Institutional Review Board. Only those potential study subjects who provided complete information in their screening questionnaires (>95%) were included in the final analysis.
SNP Selection and Genotyping
Of 258 SNPs and other genetic variants in GSTA4 reported in the dbSNP database (http://www.ncbi.nlm.nih.gov/projects/SNP/snp_ref.cgi?chooseRs=all&go=Go&locusId=2941), only three SNPs (rs4147617, rs45551133, and rs11544346) are in the coding regions and all three have very low minor allele frequency (MAF < 0.05). The Tagger algorithm with multimarker tagging was accessed via the HapMap Project (Web site: http://hapmap.ncbi.nlm.nih.gov/) and was used to determine the minimum number of SNPs that could serve as proxies for a majority of the genetic variability in the GSTA4 gene region. Using human genome B36, 12 tag SNPs were selected. Tag SNPs were defined as variants with an allele frequency of at least 0.05 that are in high linkage disequilibrium (r2 ≥ 0.8) with other SNPs in HapMap individuals of European ancestry (30). SNPs that are in high linkage disequilibrium (r2 ≥ 0.8) are very commonly inherited together. SNPs were selected to cover the entire GSTA4 gene as well as 10 kb upstream of the transcription start site and 6 kb downstream of the gene. Additionally, we chose to genotype rs182623 because it had been previously associated with lung cancer risk in a Chinese population (31). As a result, we genotyped 13 SNPs (rs17614751, rs669674, rs378775, rs17614871, rs2274760, rs3734431, rs16883343, rs17608261, rs7773621, rs367836, rs405729, rs7496, rs182623) to maximize the capture of genetic variation in the gene (13 tagging SNPs; Supplementary Table 1, available online).
DNA was extracted from the buffy-coat fraction of the blood samples by using a blood DNA mini kit (Qiagen, Inc, Valencia, CA) according to the manufacturer’s instructions. TaqMan chemistry–based genotyping assays were purchased from Applied Biosystems to genotype the 13 SNPS listed in Supplementary Table 1 (available online). The genotyping assays from 5% of the samples were repeated with 100% concordance. Any subjects for whom the PCR-based genotyping reactions failed (n = 5) were excluded from further analyses.
Genetic frequencies and odds ratios (ORs) among skin cancer case patients and control subjects
| Variable | Control subject (N = 450) | All nonmelanoma skin cancer case patient (N = 414) | Squamous cell carcinoma (N = 201) | Basal cell carcinoma (N = 213) | |||
| N (%) | N (%) | OR (95% CI)* | N (%) | OR (95% CI)* | N (%) | OR (95% CI)* | |
| RS669674 | |||||||
| GG | 377 (86.3) | 330 (80.3) | 1 | 160 (80.4) | 1 | 170 (80.2) | 1 |
| GA | 55 (12.6) | 75 (18.3) | 1.61 (1.08 to 2.34) | 35 (17.6) | 1.47 (0.89 to 2.46) | 40 (18.9) | 1.68 (1.06 to 2.64) |
| AA | 5 (1.1) | 6 (1.5) | 1.56 (0.45 to 5.35) | 4 (2.0) | 2.77 (0.61 to 12.62) | 2 (0.9) | 1.04 (0.20 to 5.53) |
| GA+AA | 60 (13.7) | 81 (19.7) | 1.60 (1.10 to 2.34) | 39 (19.6) | 1.56 (0.95 to 2.54) | 42 (19.8) | 1.63 (1.04 to 2.54) |
| RS2274760 | |||||||
| GG | 353 (79.78) | 316 (76.9) | 1 | 149 (75.3) | 1 | 167 (78.4) | 1 |
| GC | 85 (19.29) | 83 (20.2) | 1.12 (0.80 to 1.60) | 42 (21.2) | 1.18 (0.74 to 1.88) | 41 (19.3) | 1.06 (0.69 to 1.61) |
| CC | 5 (1.1) | 12 (2.9) | 3.42 (1.23 to 10.38) | 7 (3.5) | 7.84 (1.93 to 31.94) | 5 (2.4) | 2.41 (0.67 to 8.61) |
| GC+CC | 90 (20.3) | 95 (23.1) | 1.23 (0.88 to 1.73) | 49 (24.8%) | 1.39 (0.89 to 2.16) | 46 (21.6) | 1.13 (0.75 to 1.69) |
| RS16883343 | |||||||
| CC | 244 (55.5) | 231 (56.1) | 1 | 113 (56.5) | 1 | 118 (55.7) | 1 |
| CT | 157 (35.7) | 160 (38.8) | 1.11 (0.83 to 1.49) | 74 (37.0) | 1.06 (0.71 to 1.56) | 86 (40.6) | 1.19 (0.84 to 1.68) |
| TT | 39 (8.9) | 21 (5.1) | 0.60 (0.34 to 1.07) | 13 (6.5) | 0.81 (0.39 to 1.66) | 8 (3.8) | 0.44 (0.20 to 0.97) |
| CT+TT | 196 (44.6) | 181 (43.9) | 1.01 (0.76 to 1.33) | 87 (43.5) | 1.01 (0.69 to 1.46) | 94 (44.3) | 1.03 (0.74 to 1.44) |
| RS7496 | |||||||
| GG | 333 (75.7) | 331 (80.5) | 1 | 161 (80.5) | 1 | 170 (80.6) | 1 |
| GA | 94 (21.4) | 69 (16.8) | 0.63 (0.44 to 0.90) | 33 (16.5) | 0.56 (0.35 to 0.91) | 36 (17.1) | 0.66 (0.43 to 1.02) |
| AA | 13 (3.0) | 11 (27.7) | 0.78 (0.33 to 1.83) | 6 (3.0) | 0.86 (0.29 to 2.58) | 5 (2.4) | 0.74 (0.26 to 2.14) |
| GA+AA | 107 (24.3) | 80 (19.5) | 0.64 (0.46 to 0.91) | 39 (19.5) | 0.59 (0.38 to 0.94) | 41 (19.4) | 0.67 (0.44 to 1.01) |
Adjusted for age (as a continuous variable), sex, and skin color (values recorded from 1 to 10; analyzed as 1 to 5 = light; 5 to 10 = dark). CI = confidence interval.
Statistical Analyses
Statistical analyses of differences between tumor multiplicity for each mouse genotype were evaluated using the one-tailed Mann–Whitney U test included in the Prism 5 software package (GraphPad Software, La Jolla, CA). The tumor-free survival curves were compared using the one-tailed Gehan–Breslow–Wilcoxon test included in the Prism 5 software package (GraphPad Software). For analyses of time to first tumor, a time point of 39 weeks was assigned to any mouse that did not develop a tumor over the course of the study. All other comparisons were evaluated using a standard two-sided Student t test. A P value of .05 or less was considered statistically significant.
We used χ2 tests to evaluate differences between case patients and control subjects in the frequency distributions of selected demographic variables, known risk factors, and genotypes of GSTA4 polymorphisms in humans. To estimate associations between SNPs and risk of NMSC, odds ratios (ORs) and 95% confidence intervals (CIs) were calculated for all NMSC and by histological type. Multivariable unconditional logistic regression analysis was used to estimate the odds ratios simultaneously adjusted for age, sex, and skin color. Skin color measured in a self-assessed scale from 1 (light) to 10 (very dark) was analyzed categorically (light = 1–4 vs medium–dark = 5–10). The SAS ALLELE and HAPLOTYPE procedures were used to calculate linkage disequilibrium and infer haplotype frequencies based on the observed genotypes, and the global test was used for testing differences in the haplotype distributions between case patients and control subjects.
Results
Tumor Promotion Susceptibility in Congenic Mouse Strains
To identify the gene or genes that map to distal chromosome 9 and modify TPA promotion susceptibility in mice, we generated a series of interval-specific C57BL/6 congenic strains that inherited overlapping regions of distal chromosome 9 from DBA/2 mice that we designated C57BL/6.Psl1A–Fdba (Figure 1, A). C57BL/6.Psl1Adba and three subcongenic strains (B, E, and F) were tested for their sensitivity to TPA skin tumor promotion. In these experiments, 2.5 μmol of MNNG was applied to a shaven area on each of approximately 30 female mice from each subcongenic strain, followed by application of 13.6 nmol TPA twice weekly starting 2 weeks later. As expected from our previous work (22,23), C57BL/6.Psl1Adba mice, which inherited a 55.3 Mb region of chromosome 9 between D9Mit316 and D9Mit19 from DBA/2 mice, were more sensitive to TPA-mediated skin tumor promotion than C57BL/6 mice (at 36 weeks of promotion, tumor multiplicity in C57BL/6.Psl1Adba mice = 2.66 tumors per mouse, in C57BL/6 mice = 1.22 tumors per mouse, difference = 1.44 tumors per mouse, 95% CI = 0.90 to 2.00 tumors per mouse; P < .001). These data further supported the hypothesis that one or more genes that modify the response to TPA map to distal chromosome 9.
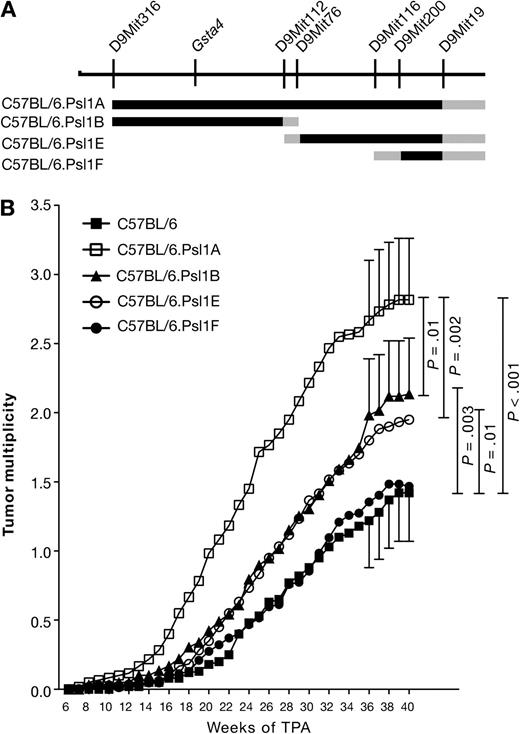
Susceptibility of C57BL.Psl1dba congenic mouse strains to 12-O-tetradecanoylphorbol-13-acetate (TPA) skin tumor promotion. A) Map of the distal end of mouse chromosome 9. Microsatellite markers and the position of glutathione S-transferase α4 (Gsta4) are shown above the chromosomal map. The black lines below the chromosome represent regions of chromosome 9 that were introgressed from DBA/2 mice onto the C57BL/6 genetic background to generate the four subcongenic strains. Gray lines represent regions that were inherited either from C57BL/6 or DBA/2 mice. B) Time course of tumor development in C57BL.Psl1dba congenic mice after promotion of skin tumors using TPA. Skin tumors in shaved female mice (C57BL/6, n = 60; C57BL/6.Psl1Adba, n = 60; C57BL/6.Psl1Bdba, n = 59; C57BL/6.Psl1Edba, n = 60; C57BL/6.Psl1Fdba, n = 62) were initiated by topical application of 2.5 μmol N-methyl-N′-nitro-N-nitrosoguanidine over the shaved dorsal skin. For tumor promotion, the mice were administered topical applications of 13.6 nmol TPA as a tumor promoter twice weekly. Tumors were counted weekly by palpation and tumor multiplicity was determined by dividing the total number of tumors by the number of mice at risk when the first tumor was observed. Similar results were obtained from two separate experiments and have been combined. The 95% confidence interval of the mean tumors per mouse is displayed for weeks 36–40. The data were analyzed using a one-sided Mann–Whitney U test.
Using subcongenic mouse strains B, E, and F, we could more finely map this tumor promotion susceptibility locus. C57BL/6.Psl1Fdba mice, which inherited the 7.5 Mb region of chromosome 9 between D9Mit200 and D9Mit19 from DBA/2 mice (Figure 1, A), did not have a statistically significantly different tumor response from that observed for C57BL/6 mice (at 36 weeks of promotion, mean tumor multiplicity in C57BL/6.Psl1Fdba mice = 1.35 tumors per mouse, difference from C57BL/6 mice = 0.13 tumors per mouse, 95% CI = −0.35 to 0.63, P = .26), indicating that genes responsible for influencing susceptibility to tumor promotion by TPA do not map to this region. Both C57BL/6.Psl1Bdba and C57BL/6.Psl1Edba displayed intermediate tumor responses that were statistically significantly different from either C57BL/6 or C57BL/6.Psl1Adba (at 36 weeks of promotion, mean tumor multiplicity in C57BL/6.Psl1Bdba = 1.98 tumors per mouse, difference from C57BL/6 = 0.76 tumors per mouse, 95% CI = 0.24 to 1.29, P = .003; difference from C57BL/6.Psl1Adba = 0.68 tumors per mouse, 95% CI = 0.09 to 1.27, P = .01; mean tumor multiplicity in C57BL/6.Psl1Edba = 1.84 tumors per mouse, difference from C57BL/6 = 0.62 tumors per mouse, 95% CI = 0.11 to 1.14, P = .01; difference from C57BL/6.Psl1Adba = 0.82 tumors per mouse, 95% CI = 0.24 to 1.41, P = .002), suggesting that at least two modifier genes map within the Psl1 locus, one mapping to a 30.5 Mb region between D9Mit316 and D9Mit76 and the other mapping to a 17.9 Mb region between D9Mit112 and D9Mit200. The locus mapping between D9Mit112 and D9Mit200 has been designated Psl1.1, and the locus mapping between D9Mit316 and D9Mit76 has been designated Psl1.2.
Increased Gsta4 Expression Following TPA Treatment
Previous global gene expression analyses revealed that at least 44 genes were differentially expressed in the epidermis of C57BL/6 vs DBA/2 mice following a regimen of four topical treatments with 3.4 nmol TPA applied twice weekly for 2 weeks (27). Of these genes, Gsta4, which maps to Psl1.2, showed the most dramatic difference in expression between TPA-treated C57BL/6 and DBA/2 mice (27). 4-HNE is a major substrate for Gsta4 (32), and this lipid peroxidation by-product has been associated with skin tumor promotion (33). These factors suggested that Gsta4 may play a role in skin tumor promotion by TPA.
In our initial studies, expression of Gsta4 mRNA was increased at least 20-fold following multiple TPA treatments in C57BL/6, but not DBA/2, epidermis as compared with that of vehicle-treated mice (27). However, it was not known whether induction of Gsta4 mRNA was a direct effect of TPA treatment or occurred as a result of the potentiated epidermal hyperplasia that occurred after multiple applications of the promoter. Therefore, we examined Gsta4 mRNA expression in the RNA samples prepared from epidermis of C57BL/6 and DBA/2 mice following a single topical application of 6.8 nmol TPA using quantitative real-time PCR where Gsta4 expression was normalized to Hras1 mRNA (Figure 2, A). Gsta4 mRNA expression was induced in C57BL/6 epidermis (but not DBA/2 epidermis) as early as 4 hours after a single TPA treatment (6.8 nmol) and remained elevated for at least 48 hours (normalized Gsta4 mRNA expression in TPA-treated vs vehicle-treated C57BL/6 mice at 4 hours posttreatment, mean = 25.5 vs 2.2 arbitrary units [AU], difference = 23.3 AU, 95% CI = 13.9 to 32.6; P = .002; normalized Gsta4 mRNA expression in TPA-treated vs vehicle-treated DBA/2 mice at 4 hours posttreatment, mean = 2.5 vs 2.4 AU, difference = 0.1 AU, 95% CI = −3.6 to 3.8; P = .94) (Figure 2, A). Thus, induction of Gsta4 mRNA can occur early after treatment and appears to be a direct effect of TPA exposure.
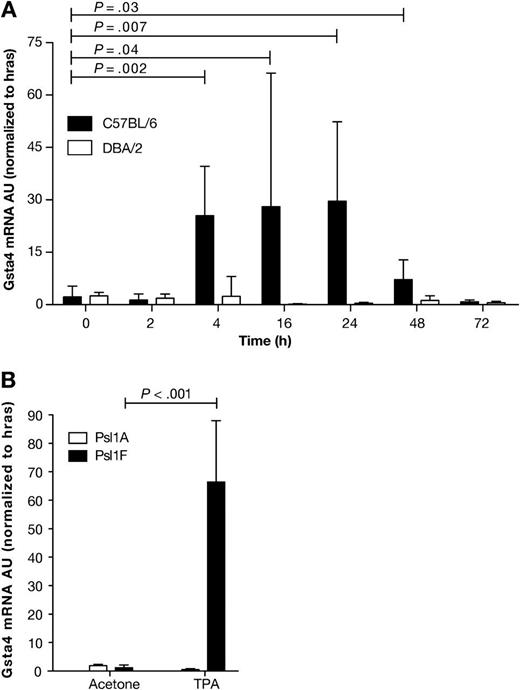
Expression of glutathione S-transferase α4 (Gsta4) mRNA in the epidermis of various inbred mouse strains following treatment with 12-O-tetradecanoylphorbol-13-acetate (TPA). A) Time course of Gsta4 mRNA accumulation in TPA promotion resistant C57BL/6 mice vs sensitive DBA/2 mice. Groups of three female C57BL/6 or DBA/2 mice were treated once topically with 6.8 nmol TPA or acetone (vehicle) and killed by cervical dislocation at the indicated time points. The dorsal skin was removed and total RNA was harvested from epidermal scrapings from individual mice. The levels of Gsta4 and Hras1 mRNA were assessed by quantitative polymerase chain reaction (qPCR). For all qPCR experiments, Gsta4 mRNA levels were normalized to Hras1 expression and presented as arbitrary units (AU). Means and 95% confidence intervals are presented. B) Gsta4 mRNA levels in C57BL/6.Psl1Adba mice (DBA/2 allele of Gsta4) vs C57BL/6.Psl1Fdba mice (C57BL/6 allele of Gsta4) following treatment with TPA. Groups of three female C57BL/6.Psl1Adba or C57BL/6.Psl1Fdba mice were topically treated once with 6.8 nmol TPA or acetone and killed 18 hours later. Epidermal mRNA was harvested from the dorsal skin of individual mice and analyzed for Gsta4 message level by qPCR as described in (A). These experiments were performed in duplicate with similar results. All P values were based on two-sided Student t tests.
Induction of Gsta4 mRNA was further examined in the epidermis of C57BL/6.Psl1 congenic strains following TPA treatment. Gsta4 mRNA levels were elevated 18 hours after a single treatment of 6.8 nmol TPA in C57BL/6.Psl1Fdba mice, which were homozygous for the C57BL/6 allele of Gsta4, but not induced in the epidermis of C57BL/6.Psl1Adba congenic mice, which harbor the DBA/2 allele for Gsta4 (mean normalized Gsta4 mRNA expression in TPA-treated vs vehicle-treated C57BL/6.Psl1Fdba mice at 18 hours posttreatment, mean = 66.4 vs 1.2 AU, difference = 65.2 AU, 95% CI = 48.6 to 81.1; P < .001; mean normalized Gsta4 mRNA expression in TPA-treated vs vehicle-treated C57BL/6.Psl1Adba mice at 18 hours posttreatment, mean = 1.9 vs 0.5 AU, difference = −1.4 AU, 95% CI = −0.9 to −1.8; P < .001) (Figure 2, B). These data support the hypothesis that Gsta4 is a skin tumor promotion susceptibility gene and that strain-dependent induction of Gsta4 is regulated by cis-acting factors and not in trans by unlinked genes.
To determine whether Gsta4 protein is also regulated in an allele-dependent manner following TPA treatment, we examined Gsta4 protein expression in epidermal protein lysates of C57BL/6 vs DBA/2 mice following treatment with TPA. For these experiments, we generated an antibody against mouse Gsta4 amino acids 209–222. Mice were killed at 4–48 hours after a single application of 6.8 nmol TPA. Western blot analyses of epidermal lysates confirmed that Gsta4 protein levels were increased at 18 hours after TPA treatment and remained elevated for at least an additional 30 hours in cytosol from the epidermal cells of C57BL/6 mice but not DBA/2 mice (Figure 3, A). These results were further verified by immunohistochemical analyses of skin sections from C57BL/6 and DBA/2 mice treated with TPA (Figure 3, B). Sections of dorsal skin from mice treated topically twice weekly for 2 weeks with either 6.8 nmol TPA or acetone alone were formalin fixed and then analyzed for Gsta4 expression using immunohistochemistry. In the absence of TPA treatment, Gsta4 protein was not detectable by immunohistochemical staining in either C57BL/6 or DBA/2 epidermis, although some nonspecific binding in sebaceous glands was noted. However, at 24 hours following the final TPA treatment, Gsta4 protein was expressed in the epidermis of C57BL/6 mice. Gsta4 protein staining was observed primarily in the suprabasal layer of the epidermis.
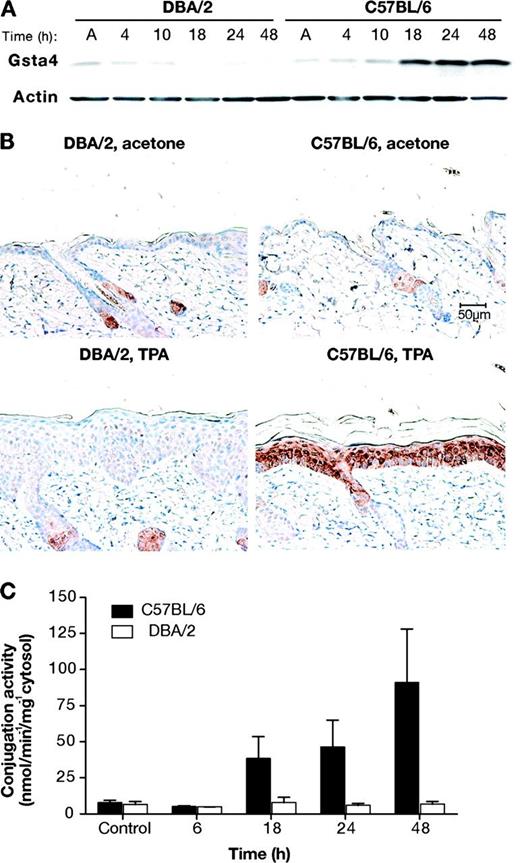
Glutathione S-transferase α4 (Gsta4) protein expression and enzymatic activity in mouse skin following treatment with 12-O-tetradecanoylphorbol-13-acetate (TPA). A) Gsta4 protein levels in C57BL/6 vs DBA/2 epidermis following TPA treatment. Groups of three female C57BL/6 or DBA/2 mice were treated topically once with 6.8 nmol TPA or acetone. Mice were killed at the indicated time points and dorsal skin was removed. Epidermal cells were harvested by scraping over a chilled glass plate and then placed in radioimmunoprecipitation assay buffer before being homogenized using an 18-gauge needle and syringe. The homogenates were cleared by centrifugation and the supernatant was analyzed for protein content. Then, equal amounts of supernatant protein were subjected to western blot analysis of Gsta4 expression. Actin protein levels were also probed as a loading control. These results are representative of three independent studies. B) Immunohistochemical staining of Gsta4 in skin sections from DBA/2 and C57BL/6 mice. Mice were treated twice weekly for 2 weeks with either 6.8 nmol TPA or acetone and killed 24 hours after the final treatment. Dorsal skin was removed and samples were formalin fixed and embedded in paraffin before staining using hemotoxylin counterstain (blue) and a rabbit polyclonal anti-Gsta4 antibody and an horseradish peroxidase–conjugated anti-rabbit secondary antibody. The peroxidase reaction was assayed using diaminobenzidine as the chromagen (brown). Representative photomicrographs are presented (scale bar = 50 μm). C) 4-hydroxy-2(E)-nonenal (4-HNE) glutathione conjugation activity in epidermal GST preparations from TPA-treated C57BL/6 and DBA/2 mice. Groups of six C57BL/6 and DBA/2 mice were killed at the indicated time points following a single topical application of 6.8 nmol TPA, and the dorsal skins were removed. The epidermis was harvested and homogenized, and then cytosolic glutathione S-transferases were purified from the epidermal lysates using a glutathione–agarose column. Conjugation activity toward 4-HNE was assessed spectrophotometrically and normalized to protein content. The mean specific activity and 95% confidence interval are presented. These experiments were performed in duplicate with similar results.
As noted in the introduction, a major substrate for Gsta4 is 4-HNE. To address whether increased expression of Gsta4 protein in the epidermis of C57BL/6 mice leads to increased enzymatic activity, C57BL/6 and DBA/2 mice were treated once topically with 6.8 nmol TPA or acetone alone, and epidermal lysates were tested for conjugation activity toward 4-HNE. Gsta4 activity toward 4-HNE was induced approximately 12-fold in the epidermis of C57BL/6, but not DBA/2 mice, at 48 hours following TPA treatment (mean nmol min−1 mg−1 cytosol in TPA-treated DBA/2 vs TPA-treated C57BL/6 mice at 48 hours after treatment, mean = 6.7 vs 90.9 nmol min−1 mg−1 cytosol, difference = 84.2, 95% CI = 48.4 to 120.2) (Figure 3, C).
Susceptibility of Gsta4-Deficient Mice to Tumor Promotion
To directly test the hypothesis that Gsta4 expression alters sensitivity to tumor promotion, we obtained C57BL/6 mice deficient for Gsta4 (C57BL/6.Gsta4−/−). As expected, Gsta4 expression following treatment with TPA was absent in the epidermis of C57BL/6.Gsta4−/− mice based on both western blot and immunohistochemical analyses (Figure 4, A and B, respectively), and no conjugation activity toward 4-HNE was detected in the epidermis of C57BL/6.Gsta4−/− mice after treatment with TPA (Figure 4, C). Consistent with this observation, following treatment with TPA, glutathione conjugates of 4-HNE were elevated in the epidermis of wild-type mice compared with that of untreated control mice (Figure 4, D); however, the level of conjugated 4-HNE was not elevated by treatment with TPA in C57BL/6.Gsta4−/− mice (mean pg/mg protein in TPA-treated vs vehicle-treated C57BL/6.Gsta4−/− mice at 24 hours posttreatment, mean = 82.1 vs 30.5 pg/mg protein, difference = 51.6, 95% CI = 14.1 to 89.2; P = .01; mean pg/mg protein in TPA-treated vs vehicle-treated C57BL/6.Gsta4−/− mice at 24 hours posttreatment, mean = 26.8 vs 44.7 pg/mg protein, difference = −17.9, 95% CI = −37.7 to 1.8; P = .07) (Figure 4, D). These results indicate that there was little or no residual 4-HNE conjugation activity in the absence of Gsta4 in the epidermis of C57BL/6 mice following treatment with TPA.
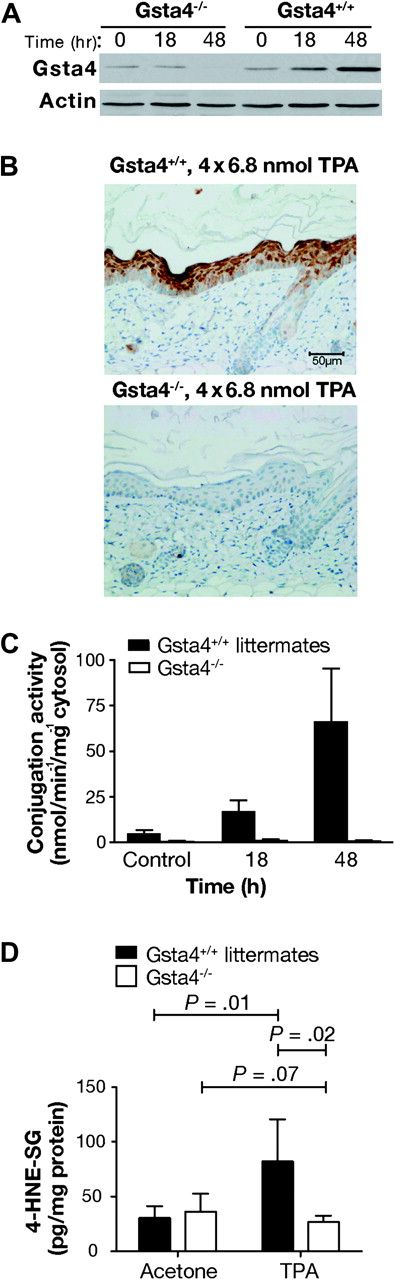
Epidermal 4-hydroxy-2(E)-nonenal (4-HNE) conjugation capacity in glutathione S-transferase α4 (Gsta4)-deficient vs wild-type mice. A) Western blot analysis of Gsta4 protein expression in Gsta4-deficient vs wild-type mice. Gsta4-deficient mice and littermate controls were treated with 6.8 nmol 12-O-tetradecanoylphorbol-13-acetate (TPA) or vehicle and killed at various time points. The dorsal skin was removed and the epidermis was scraped into radioimmunoprecipitation assay buffer before being homogenized with an 18-gauge needle and syringe. The homogenates were cleared by centrifugation and the supernatant was assayed for protein content. Then equal amounts of supernatant protein were analyzed for Gsta4 protein expression by western blot. Actin protein expressed is presented as a loading control. This experiment was performed in triplicate with similar results. B) Immunohistochemical analysis of Gsta4 protein expression in Gsta4-deficient vs wild-type mice. Gsta4-deficient and wild-type mice (n = 3 per strain) were treated topically with TPA twice weekly for 2 weeks and 48 hours after the final treatment the mice were killed and the dorsal skin removed. Skin sections were formalin-fixed, embedded, and examined for Gsta4 expression by immunohistochemistry as described above (see Figure 3, B). C) 4-HNE glutathione conjugation activity in epidermal GST preparations from Gsta4-deficient vs wild-type mice. Groups of six Gsta4-deficient and wild-type mice were killed at the indicated time points following topical treatment with TPA and the dorsal skins were removed. The epidermis was harvested, pooled, and homogenized, and then cytosolic glutathione S-transferases were purified from the epidermal lysates using a glutathione–agarose column. Conjugation activity toward 4-HNE was assessed spectrophotometrically and normalized to protein content. The mean and 95% confidence interval are displayed. This experiment was performed in duplicate with similar results. D) Glutathione-conjugated metabolites of 4-HNE in epidermis of Gsta4-deficient and wild-type mice following TPA treatment. Gsta4-deficient mice and littermate controls were treated twice weekly for 2 weeks with 3.4 nmol TPA, and 24 hours following the final treatment, epidermal scrapings were harvested from at least three individual mice per group. Glutathione-conjugated metabolites of 4-HNE in the epidermal samples were detected by Liquid Chromatography-Tandem Mass Spectrometry. The mean and 95% confidence are presented. This experiment was performed in triplicate with similar results and the data have been combined. All P values were based on two-sided Student t tests. 4-HNE-SG = glutathione conjugated 4-HNE.
Next, we conducted experiments to evaluate the sensitivity of C57BL/6.Gsta4−/− mice to skin tumor promotion by TPA. Age-matched female C57BL/6.Gsta4−/− and wild-type controls (at least 24 mice per group) were initiated with 100 nmol DMBA and then promoted twice weekly with 3.4 nmol TPA for 38 weeks. The tumor response was monitored weekly by visual inspection of the dorsum. The study was performed in duplicate for a total of at least 53 mice per strain. After 38 weeks of promotion, the tumor multiplicity in C57BL/6.Gsta4−/− mice was statistically significantly greater than that in wild-type littermates, and tumors appeared at an earlier age in these mice (mean tumor multiplicity in C57BL/6.Gsta4−/− mice = 0.8 tumors per mouse, in wild-type mice = 0.4 tumors per mouse; difference = 0.4 tumors per mouse, 95% CI (on the difference) = 0.1 to 0.7, P = .007; mean time of tumor appearance in C57BL/6.Gsta4−/− mice = 32.6 weeks, in wild-type mice = 37.1 weeks; difference = −4.5 weeks, 95% CI (on the difference) = 2.2 to 6.9, P = .006, Gehan–Breslow–Wilcoxon) (Figure 5). No tumors developed in uninitiated control mice treated only with TPA. Thus, C57BL/6.Gsta4−/− mice were more sensitive than wild-type C57BL/6 mice to skin tumor promotion by TPA. These data provide evidence that Gsta4 is a novel susceptibility gene that underlies at least a portion of the effect of Psl1.2 on skin tumor promotion by TPA and suggest that 4-HNE and/or possibly other Gsta4 substrates generated during tumor promoter treatment may mediate certain aspects of the tumor promotion process.
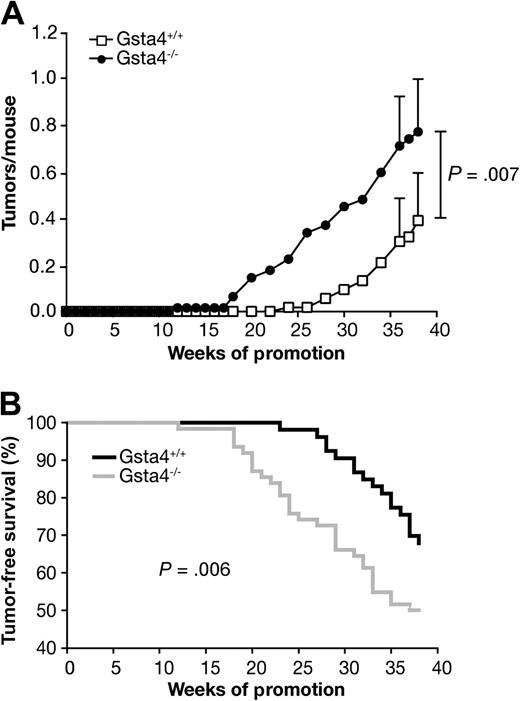
Susceptibility of C57BL/6.glutathione S-transferase α4 deficient (Gsta4−/−) vs wild-type mice to tumor promotion by TPA. Groups of at least 24 mice of each strain were initiated by topical application of 100 nmol 7,12-dimethylbenz(a)anthracene to the shaved dorsal skin and promoted twice weekly with 3.4 nmol TPA for 38 weeks. Tumors were counted weekly by palpation and tumor multiplicity was determined by dividing the total number of tumors by the number of mice at risk when the first tumor was observed. Two independent experiments were performed with similar results; therefore, the data have been combined (C57BL/6.Gsta4−/−, n = 62; C57BL/6.Gsta4+/+, n = 53). A) Time course of tumor development in Gsta4-deficient and wild-type mice. Tumor multiplicity was statistically significantly higher in Gsta4-deficient mice than in wild-type mice at 38 weeks (P = .007, one-tailed Mann–Whitney U test). The mean and 95% confidence interval for tumor multiplicity at 36 and 38 weeks are presented. B) Tumor latency in Gsta4-deficient and wild-type mice. Tumor latency was decreased in Gsta4-deficient mice (P = .006, Gehan–Breslow–Wilcoxon). The number of mice at risk for weeks 0, 20, and 38 were 53, 53, 36 for wild-type and 62, 54, and 31 for Gsta4-deficient mice.
Inheritance of GSTA4 Polymorphisms and NMSC Risk in Humans
Because our studies in mice supported a role for Gsta4 in skin tumor promotion, we sought to determine whether genetic variation in human GSTA4 similarly affected risk of NMSC. In humans, the GSTA4 gene product also exhibits uniquely high conjugation activity toward 4-HNE (34) and is considered a functional ortholog of mouse Gsta4. To determine whether GSTA4 also affects susceptibility to skin cancer in humans, we conducted a case–control study of 414 NMSC patients and 450 unrelated control subjects. All study participants were white, between the ages of 24 and 93 years, and were patients or visitors at the MD Anderson Cancer Center in Houston. Data on selected known risk factors for nonmelanoma skin cancer (age, sex, skin color, and freckling in the sun as a child) were collected (Supplementary Table 2, available online). We examined the genotype frequency of 13 tag SNPs that were selected to cover the entire GSTA4 gene region, including approximately 10 kb upstream and approximately 6 kb downstream of the gene (see Supplementary Table 1, available online). Those SNPs which showed potential associations with NMSC risk in our initial univariate analysis (rs669674, rs2274760, rs16883343, rs7496 [data not shown]) were selected for multivariable regression analysis.
Frequencies of haplotypes of the four most statistically significant glutathione-S-transferase α4 single-nucleotide polymorphisms (SNPs) identified in the single locus analysis (Table 1) and their associations with risk of nonmelanoma skin cancer (NMSC)*
| Haplotype† | Haplotype distribution‡ | OR (95% CI)§ | |
| Control subject, N (%) | NMSC case patient, N (%) | ||
| Total Chr no. | 894 | 828 | |
| G-G-C-G | 400 (44.7) | 366 (44.2) | 1 |
| G-G-T-G | 214 (24.0) | 177 (21.4) | 0.91 (0.71 to 1.17) |
| G-C-C-G | 93 (10.4) | 101 (12.2) | 1.29 (0.93 to 1.80) |
| A-G-C-G | 65 (7.3) | 87 (10.5) | 1.50 (1.04 to 2.14) |
| G-G-C-A | 101 (11.3) | 72 (8.7) | 0.67 (0.47 to 0.94) |
| Others | 21 (2.3) | 25 (3.0) | 1.35 (0.77 to 2.37) |
Chr no. = chromosome number; CI = confidence interval; OR = odds ratio.
The combination of four SNPs: rs669674G/A–rs2274760G/C–rs16883343C/T–rs7496G/A. Among the control subjects, the genotype frequencies for each SNP were in agreement with the Hardy–Weinberg disequilibrium (P > .05). The category “Others” includes those haplotypes present at frequencies less than 0.05. All pairs of SNPs were in weak linkage disequilibrium (0.005 < r2 < 0.172).
Global test (two-sided): P = .047.
Adjusted for age, sex, and skin color.
After adjusting for known risk factors for NMSC (skin color, age, and sex), four SNPs (rs669674, rs2274760, rs7496, and rs16883343) were found to be associated with skin cancer risk (Table 1). A statistically significantly increased risk for NMSC (basal cell and squamous cell carcinoma cases combined) was associated with the GA genotype (OR = 1.61; 95% CI = 1.08 to 2.34) and the combined GA+AA (OR = 1.60; 95% CI = 1.10 to 2.34) genotypes for rs669674 as well as with the CC genotype for rs2274760 (OR = 3.42; 95% CI = 1.23 to 10.38). The rs669674 GA and combined GA+AA genotypes appeared to be primarily associated with risk of basal cell carcinoma (GA, OR = 1.68; 95% CI = 1.06 to 2.64; GA+AA, OR = 1.63; 95% CI = 1.04 to 2.54), whereas the rs2274760 CC genotype was primarily associated with increased risk of squamous cell carcinoma (OR = 7.84; 95% CI = 1.93 to 31.94). By contrast, a statistically significantly decreased risk of NMSC (again, both basal cell and squamous cell carcinoma cases combined) was associated with the GA (OR = 0.63; 95% CI = 0.44 to 0.90) genotype and the GA+AA combined (OR = 0.64; 95% CI = 0.46 to 0.91) genotypes for rs7496. These genotypes were primarily associated with decreased risk of squamous cell carcinoma (GA, OR = 0.56; 95% CI = 0.35 to 0.91; GA+AA, OR = 0.59; 95% CI = 0.38 to 0.94). Although there was no association with rs16883343 genotypes and NMSC risk (again, all cases combined), there was an association of the rs16883343 TT genotype with decreased basal cell carcinoma risk (OR = 0.44; 95% CI = 0.20 to 0.97).
Because the tag SNPs were not in complete linkage disequilibrium (ie, r2 < 1.0), we performed haplotype analyses that would provide additional information about the combined effects of the selected tag SNPs. Haplotype analysis of the four SNPs described above was performed for all NMSC cases combined because of the small sample sizes for basal cell carcinoma and squamous cell carcinoma. Of the 14 haplotypes revealed, five were present at allele frequencies greater than 0.05 (Table 2). The haplotypes statistically significantly associated with the risk of NMSC were those that carried the rs669674 A allele (OR = 1.50, 95% CI = 1.04 to 2.14) and the rs7496 A allele (OR = 0.67; 95% CI = 0.47 to 0.94) (Table 2). These findings are consistent with those shown in Table 1 and suggest that the genotypes and haplotypes of GSTA4 affect risk of NMSC in humans.
The results of this study support the hypothesis that inheritance of polymorphisms in or near the GSTA4 gene is associated with altered risk of NMSC in humans, further supporting the hypothesis that Gsta4/GSTA4 is a modifier of skin tumor susceptibility. These results demonstrate that an integrated cross-species gene mapping approach in mice and humans is an effective method for identification of novel genetic modifiers of NMSC susceptibility.
Discussion
In this series of studies, we have confirmed that one or more genes that map to distal chromosome 9 in mice act to modify sensitivity to skin tumor promotion by TPA (22–24). These new studies, which use C57BL/6.Psl1dba interval-specific congenic strains, demonstrate that Psl1 is a complex locus that includes at least two genes, one mapping to Psl1.1 and one mapping to Psl1.2, that modify skin tumor promotion susceptibility. The genes that map to Psl1.1 and Psl1.2 appear to contribute additively to susceptibility to tumor promotion by TPA.
By assimilating our gene mapping findings with previous global gene expression results, we identified Gsta4 as a candidate skin tumor promotion susceptibility gene that maps to Psl1.2. Gsta4, which metabolizes a reactive lipid peroxidation by-product associated with tumor promotion, was increased in the epidermis of TPA-treated C57BL/6 mice relative to DBA/2 mice, suggesting that polymorphisms that affect Gsta4 transcript abundance may modify susceptibility to skin tumor promotion. C57BL/6 mice deficient for Gsta4 were found to be more sensitive than wild-type C57BL/6 mice to skin tumor promotion by TPA, providing compelling evidence that Gsta4 modifies susceptibility to tumor promotion. Finally, inheritance of polymorphisms in GSTA4 appears to alter risk of NMSC in humans. In a preliminary study, increased risk of NMSC was associated with the GA and combined GA+AA genotypes for rs669674 and the CC genotype for rs2274760, whereas the rs16883343 TT genotype was associated with reduced risk of basal cell carcinoma. Variant genotypes for rs7496 were associated with reduced risk of squamous cell carcinoma.
The data from the mouse skin carcinogenesis model indicate that Gsta4 modifies susceptibility to skin tumor promotion. During tumor promotion, carcinogen-initiated cells undergo clonal expansion. The process of tumor promotion is complex but is believed to involve alterations in gene expression and cell signaling molecules that ultimately lead to epidermal hyperproliferation (16,35). Numerous lines of evidence support a role for oxidative stress during tumor promotion in mouse skin (reviewed in 36). For example, after topical treatment with TPA, levels of reactive oxygen species such as hydroperoxides and lipid peroxides increased, whereas the activity of antioxidant enzymes such as superoxide dismutase, catalase, and glutathione peroxidase decreased in epidermal cells (36). Additionally, strain sensitivity to skin tumor promotion by TPA has been associated with the extent of oxidant response following treatment (SSIN>SENCAR>C57BL/6) (37,38). Furthermore, treatment of mice with compounds having antioxidant activity has been reported to suppress TPA promotion of papilloma formation (reviewed in 36).
Gsta4 is known to metabolize 4-HNE as well as other lipid peroxidation products (32); therefore, the identification of Gsta4 as a skin tumor promotion susceptibility gene suggests that 4-HNE generated during lipid peroxidation may play an important role in tumor promotion. 4-HNE is a highly reactive, but stable, aldehyde, generated during oxidative degradation of fatty acids such as arachidonic and linoleic acids (reviewed in 39), and an association between 4-HNE level and the magnitude of TPA skin tumor promotion response has been reported (33). Numerous cellular effects of elevated 4-HNE have been documented and support a role for 4-HNE-mediated signaling during tumor promotion. For example, depending on its intracellular concentration and the cell type examined, 4-HNE has been shown to stimulate cell proliferation and to block differentiation (40,41). Gsta4 catalyzes glutathione conjugation to 4-HNE and is thus a major regulator of 4-HNE levels (29,32,34,39). Although our work suggests that Gsta4 may play a role in tumor promotion by regulating 4-HNE, other endogenous substrates for Gsta4 have also been described, including 15-A2t-isoprostane, prostaglandin A2 (42), 13-oxooctadeca-9,11-dienoic acid (43), and leukotriene A4 methyl ester (32). Therefore, the exact mechanism by which Gsta4 protects against tumor promotion in C57BL/6 mice warrants further investigation.
Following TPA treatment, Gsta4 mRNA was not induced in the epidermis of C57BL/6.Psl1dba congenic mice that inherit the DBA/2 allele for Gsta4 (Figure 2, B). Based on these data, we hypothesize that the mechanism underlying strain-specific induction of Gsta4 likely involves cis-acting factors in or near the Gsta4 gene. Although a variety of gene regulation mechanisms have been described for other GST isoforms, such as Gsta2 and Gstp1, the regulation of Gsta4 expression is relatively unexplored. Nonetheless, treatment with interleukin-6, epidermal growth factor, Ca2+, and ultraviolet light have all been shown to increase Gsta4 expression either in vitro or in vivo in various species (44–46). Several lines of evidence point to involvement of the transcription factor, Nrf2, in Gsta4 gene regulation, including the existence of a putative antioxidant responsive element in the 5′ flanking region of the mouse gene. Additionally, Gsta4 expression is reduced in both the liver and small intestine of Nrf2-deficient mice (47,48). However, no polymorphisms were noted within the core base pairs of the putative antioxidant responsive element between C57BL/6 and DBA/2 sequence.
The GSTA4 gene maps to chromosome 6p12.1 in the human genome. Like its rodent orthologs, the human GSTA4 gene product is distinguished by high conjugation activity toward 4-HNE (32,34) and is reportedly induced upon exposure of the skin to ultraviolet light (46,49). A polymorphism in GSTA4 has been linked with hepatocellular carcinoma risk in men (50), and inheritance of a polymorphism in the promoter region of GSTA4 has been associated with altered risk of lung carcinoma (31). These studies, in light of the findings presented here, indicate that inheritance of polymorphisms within the human GSTA4 gene may be predictive of risk of cancers in several epithelial tissues. The functional effect of the rs16883343, rs2274760, rs669674, and rs7496 polymorphisms, which were associated with NMSC risk in this study, is currently unknown; however, their position within promoter, intronic, and 3′untranslated regions suggests potential effects on GSTA4 mRNA expression, stability, or translation. Alternatively, these polymorphisms may be in high linkage disequilibrium with additional polymorphisms that affect GSTA4 expression, stability, or activity.
This study has several limitations. The direct mechanism by which Gsta4 modifies skin tumor development has not been determined. Although 4-HNE is a major substrate of Gsta4 and may play a role in cancer development, other substrates may also be involved. In addition, Gsta4 may possess functions not associated with catalytic activity. Additional studies will be required to determine the mechanism by which Gsta4 modifies skin tumor susceptibility. Another limitation of this study is that a gene closely linked to Gsta4 may be responsible for the effects of Psl1.2. Although this is unlikely, given the data presented in this article, additional studies using knock-in mice or bacterial artificial chromosome transgenic mice will be needed to completely eliminate this possibility. A third limitation of this study is the sample size of the human case–control study, and the nature of hospital-based case–control selection design, which may result in an uncontrolled bias in our selection of participants. Larger, population-based studies will be required to further validate these results.
The work reported here underscores the multigenic nature of susceptibility to epithelial carcinogenesis and reveals the complexity of a major locus (Psl1) for skin tumor promotion susceptibility. Considerable evidence indicates that carcinogenesis in humans occurs via a multistage process (51), and tumor promotion is an important component of this process (16). Identification of additional novel tumor promotion susceptibility genes using gene mapping approaches and cross-species comparisons (13,15) together with other approaches will lead to identification of novel mechanisms and targets for the prevention of skin cancers and possibly other cancers in humans.
Funding
National Institutes of Health (R01 ES016623, R01 ES015718); the University of Texas M. D. Anderson Cancer Center Support Grant (P30 CA016672); the National Institute of Environmental Health Sciences Center Grant (P30 ES007784); and the National Cancer Institute Research Training in Carcinogenesis and Mutagenesis Training Grant (T32 CA009480).
References
E. L. Abel and J. M. Angel contributed equally to this work.
Present address: Division of Pharmacology & Toxicology, College of Pharmacy, The University of Texas at Austin, Austin, TX (J. M. Angel, J. DiGiovanni).
Present Address: Department of Animal Science, Texas A&M University, College Station, TX (P. K. Riggs).
The glutathione-conjugated 4-HNE standard was kindly provided by Dr Matthew Picklo. The authors thank Huifeng Zhang, Linda Beltran, Steve Carbajal, Nancy Otto, Kelli Kochan, John Repass, and Stephen Meyer for excellent technical assistance and Shawna Johnson and Stephanie Tomlinson for assistance in preparing this manuscript. The funding sponsors for the studies presented in this article had no role in the design, analysis or interpretation of the data. In addition, the funding sponsors had no role in the writing or publication decisions related to this article.

